Skip to main content
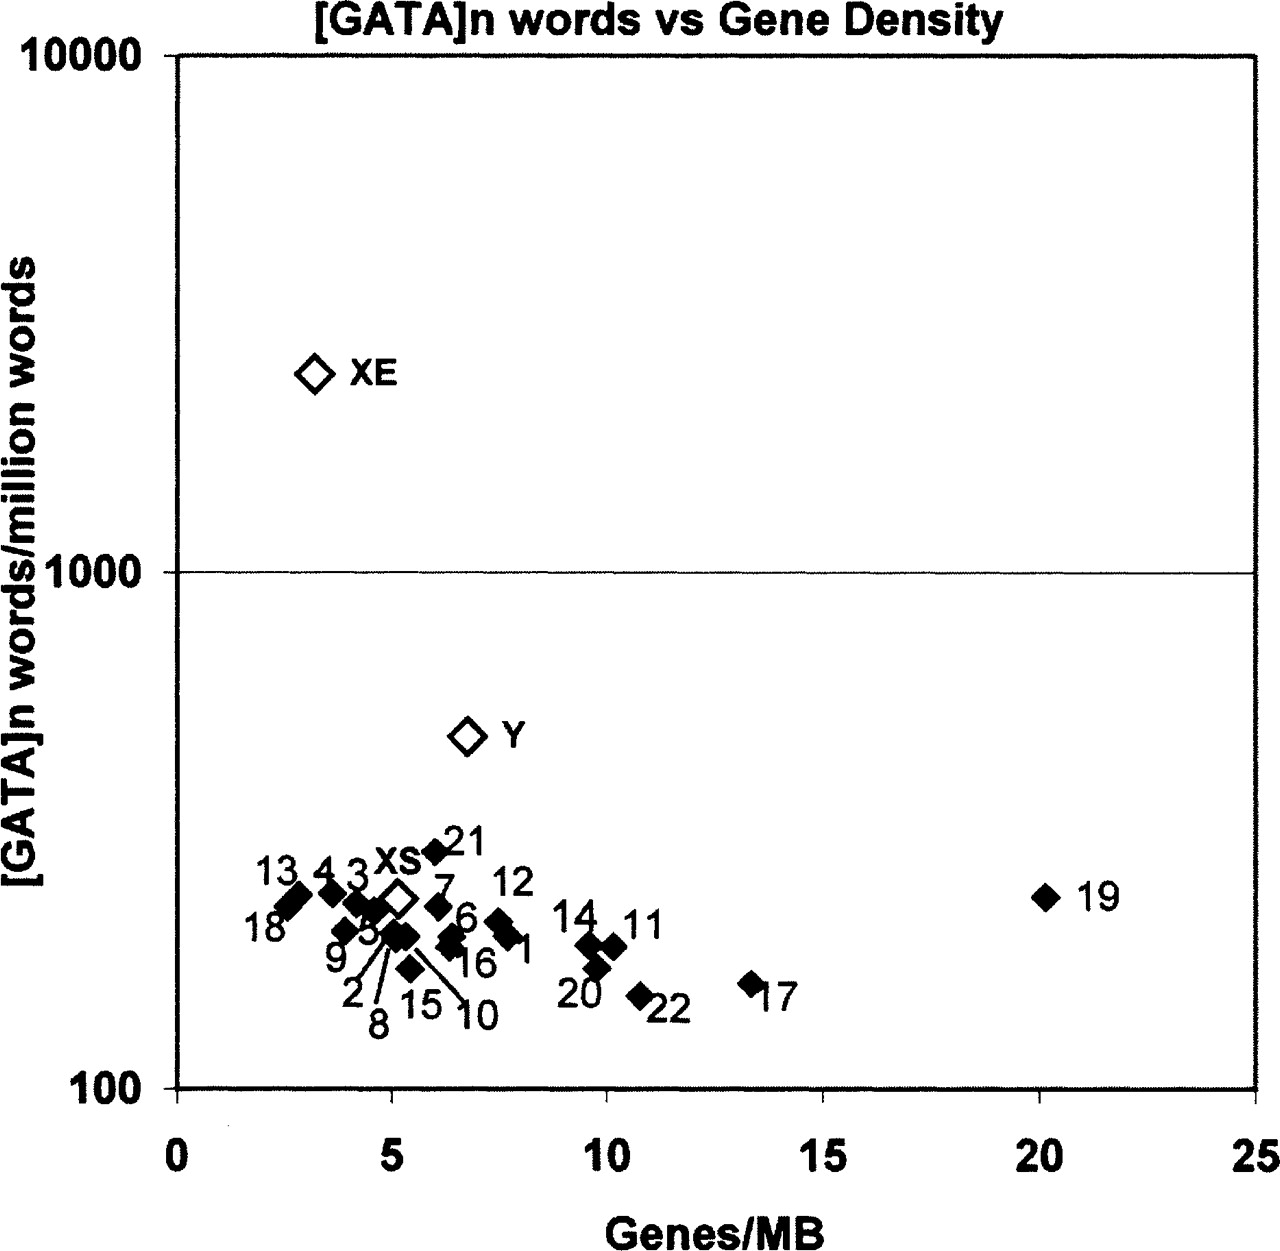
Figure 4.
Scatter plot of [GATA]
n
-derived word density vs. gene density for each chromosome.