Figure 4.
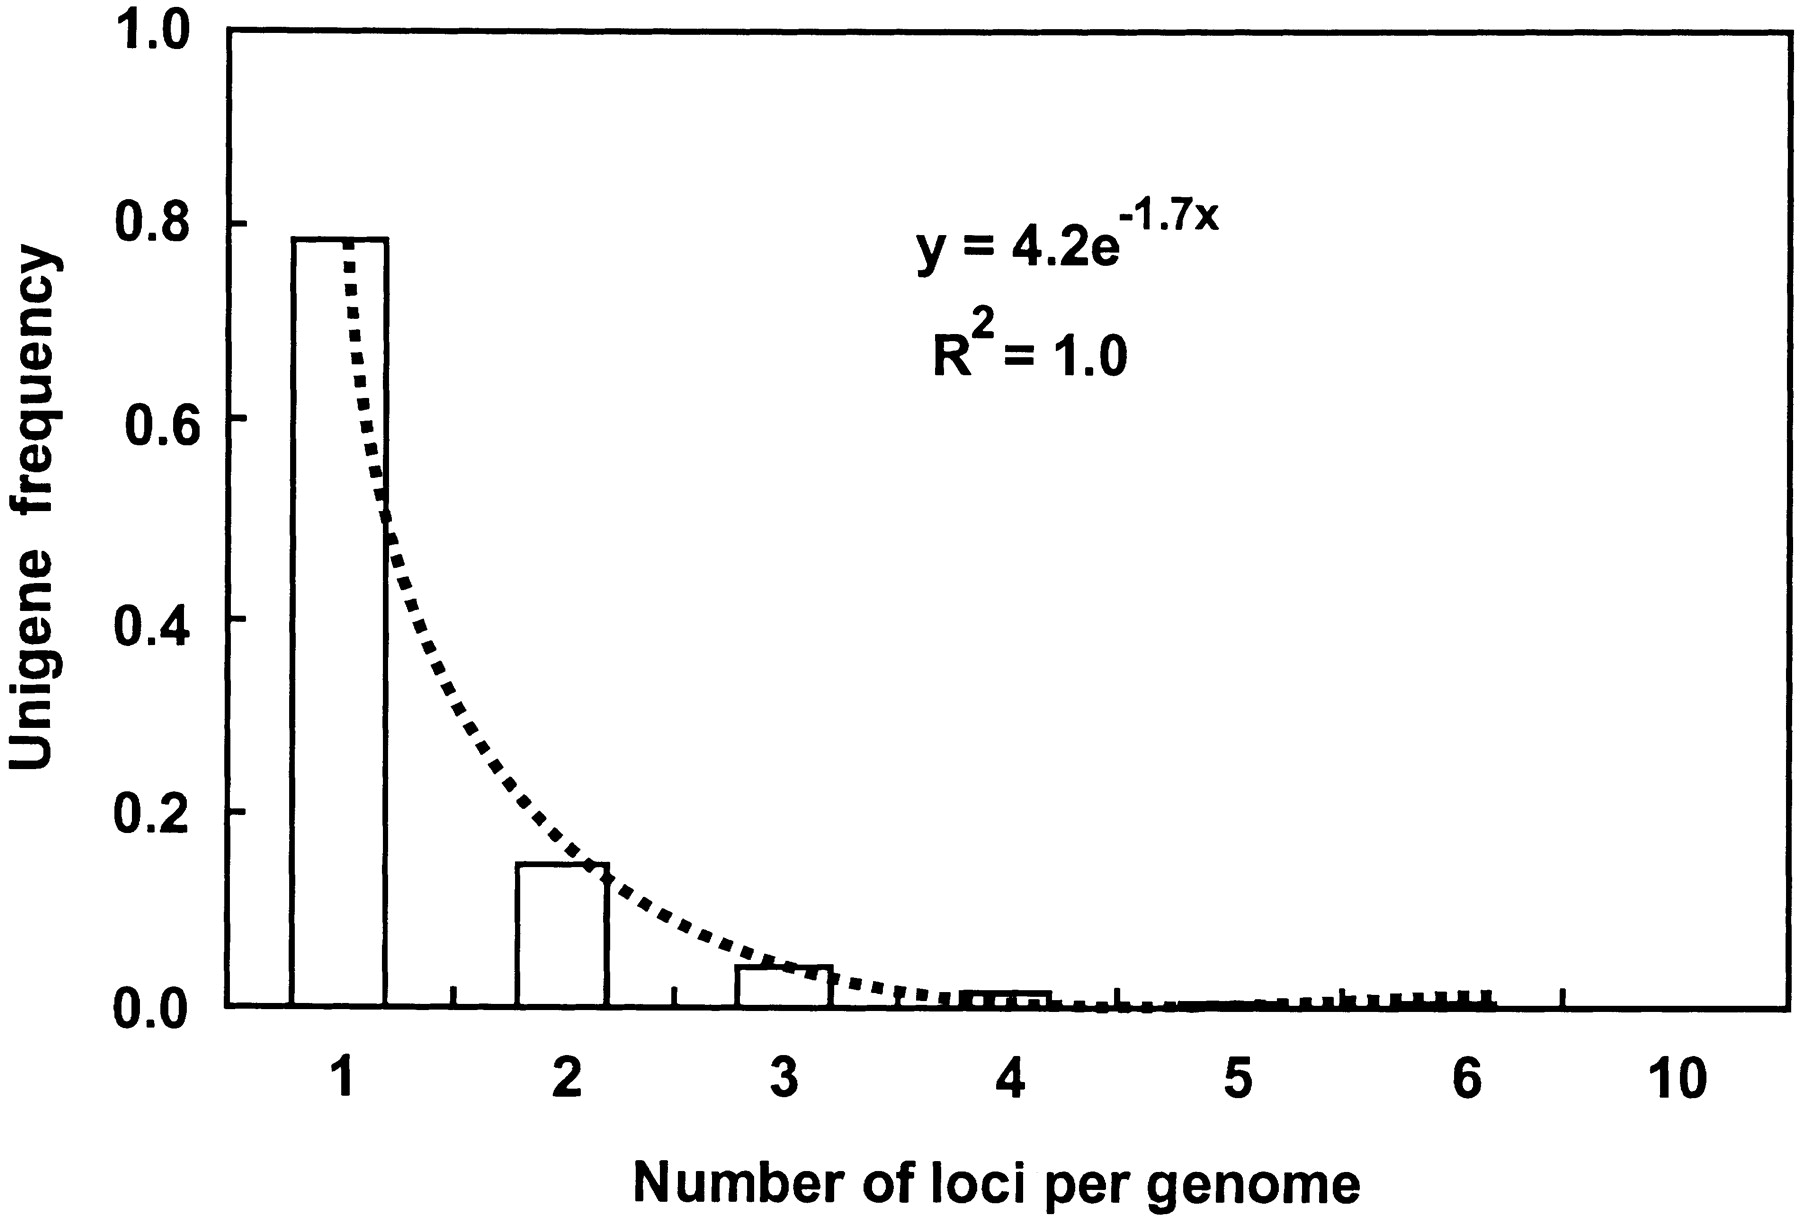
Frequencies of EST unigenes detecting the indicated numbers of loci within a genome. The curve and the exponential equation best fitting the data are shown.
Frequencies of EST unigenes detecting the indicated numbers of loci within a genome. The curve and the exponential equation best fitting the data are shown.