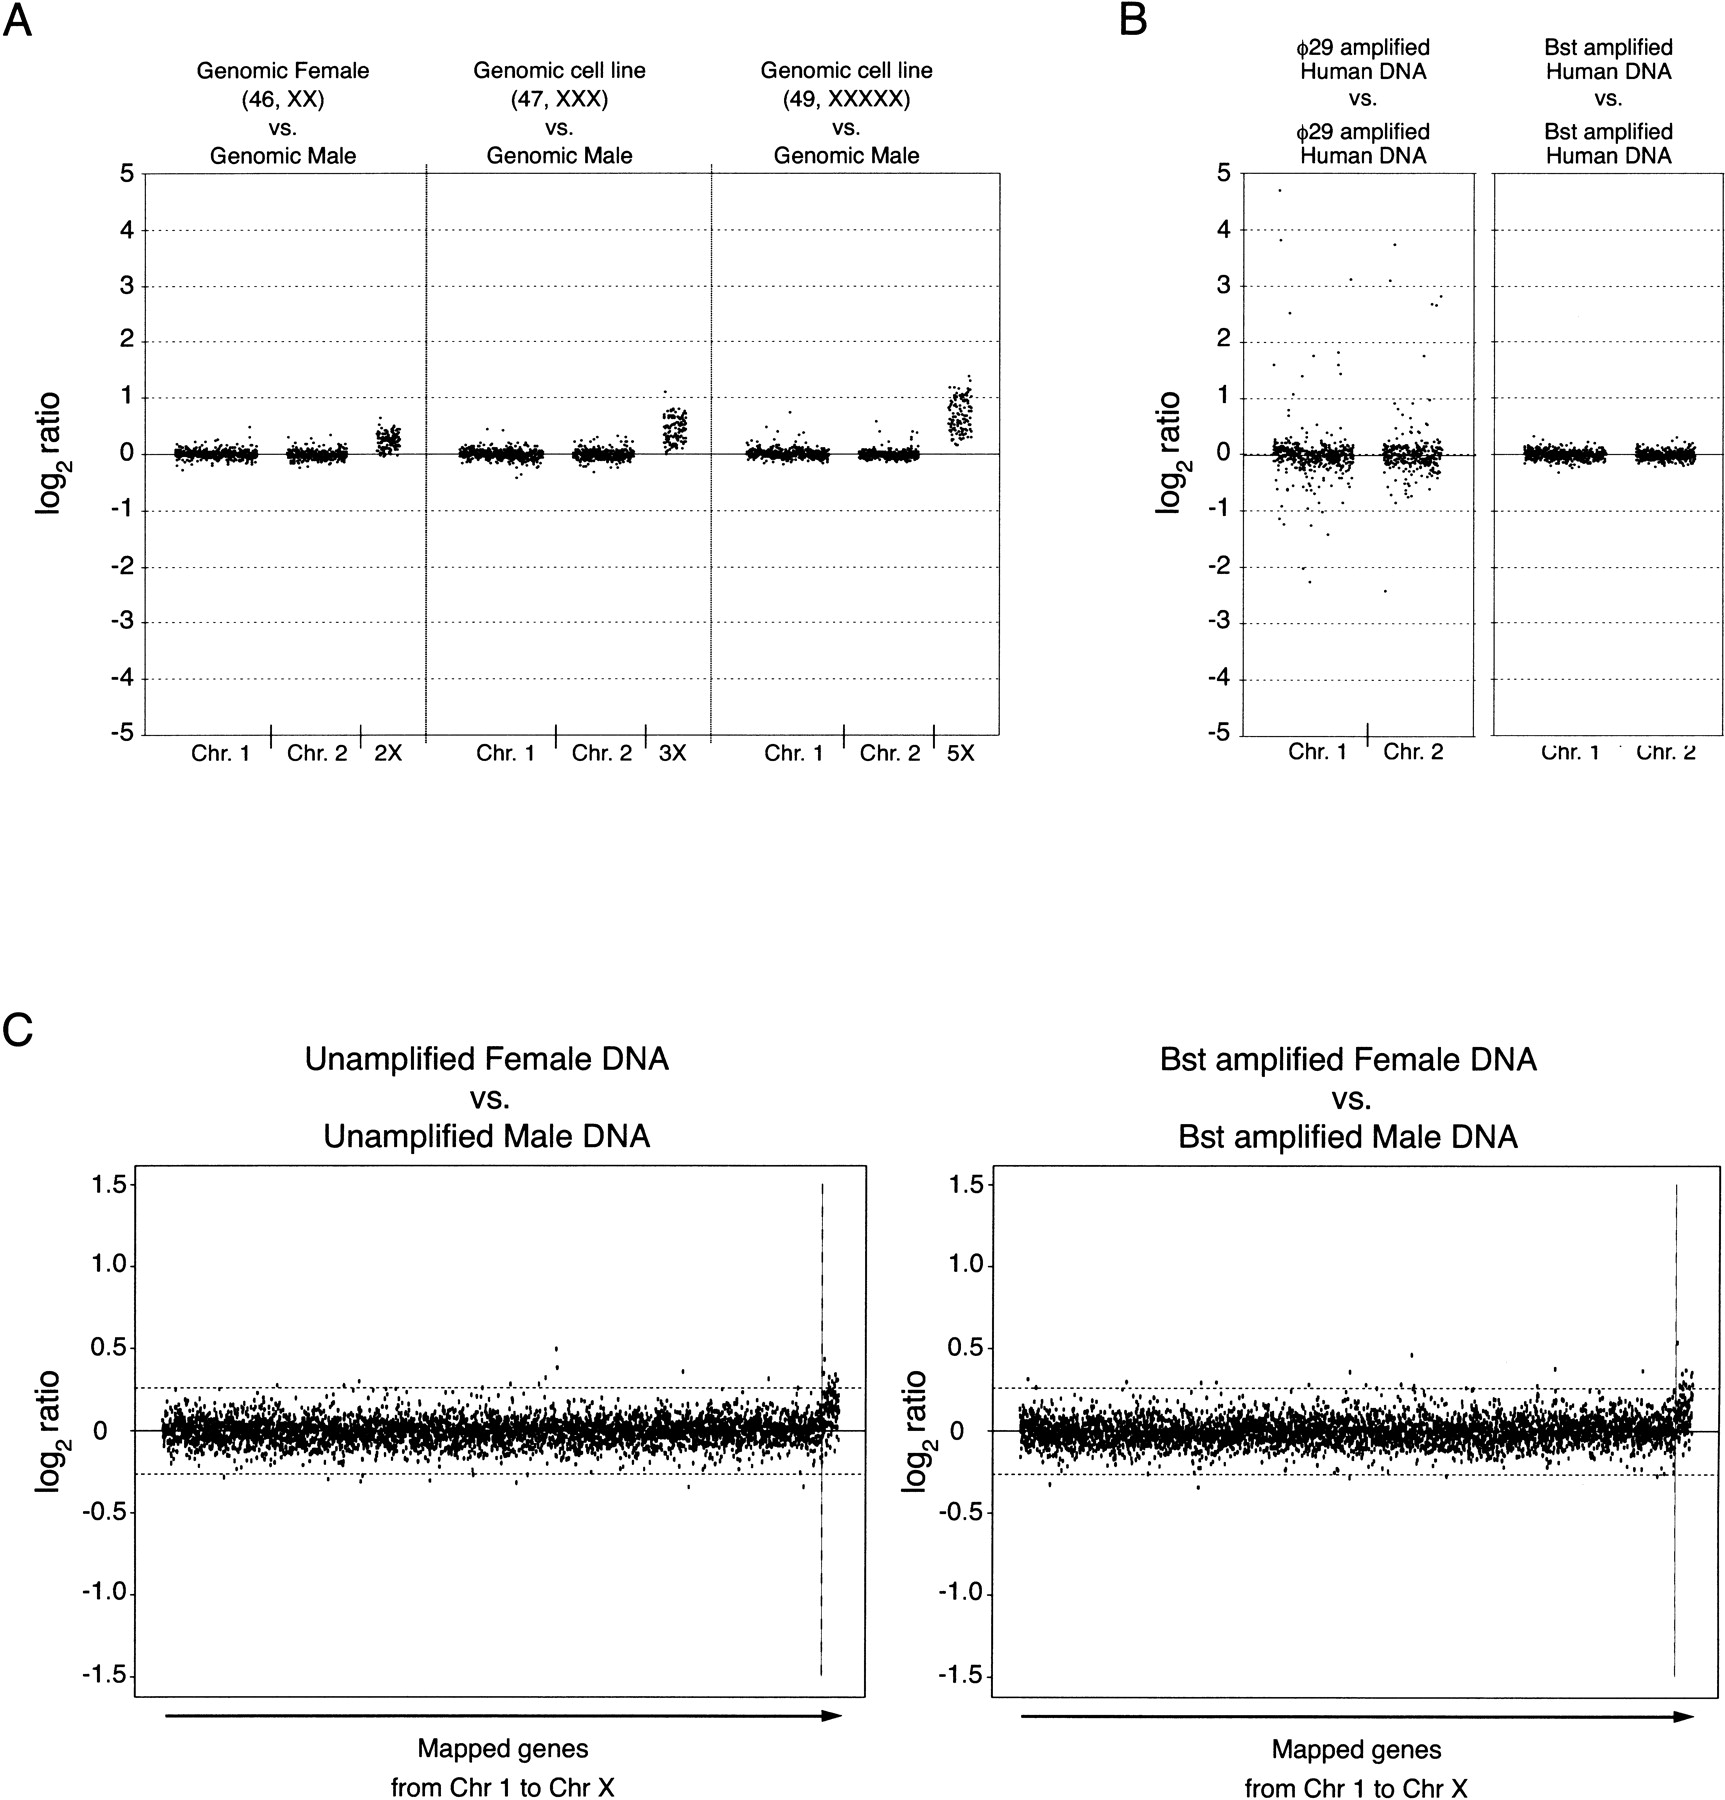
Evaluation of DNA amplification bias using array–CGH on human cDNA microarrays. (A) To assess the extent of dynamic range compression, three microarray–CGH experiments were performed in duplicate using genomic female DNA (46, XX) versus genomic male DNA, or DNA from cell lines containing 3 X-chromosomes (47, XXX) and 5 X-chromosomes (49, XXXXX) with a normal number of autosomes against genomic male DNA. Autosomal genes located in Chromosomes 1 and 2 are compared with genes located in Chromosome X for the same set of experiments. Ratio values correspond to the average of two independent experiments, and are displayed in a log2 scale. Averaging the log2 ratios for the X-linked probes in the three different experiments gives values of 0.234 ± 0.143 (1.176 in linear scale, average of 112 probes), 0.423 ± 0.220 (1.341 in linear scale, average of 113 probes), and 0.681 ± 0.290 (1.603 in linear scale, average of 115 probes) for the 2X, 3X, and 5X experiments, respectively. Dynamically compressed ratios can be converted to actual ratios by fitting log2 values to a power-law mathematical formula as described by Yuen et al. (2002). (B) Comparison of DNA polymerase-induced representational distortion using human DNA samples. Normal human DNA was amplified with either φ29 orBst DNA polymerase, labeled with Cy3, and hybridized against similarly amplified human DNA labeled with Cy5. Plots for Chromosomes 1 and 2 are shown in the same scale as the plot in A. (C) Confidence limits for array–CGH analysis of human DNA. Plots correspond to unamplified human female versus male DNAs and whole genome Bst-amplified human female versusBst-amplified male DNAs. Average log2 fluorescence ratios for replicate spots are ordered according to the chromosome number and the position in the chromosome. Ratio values for X-linked genes show a similar distribution to that observed for the 2X dosage inA. Confidence limits (horizontal dashed lines) for 99.9% of data for autosomal genes are between −0.262 and 0.262 (0.833 and 1.199 when expressed as linear ratios) for the unamplified experiment. The same confidence bounds calculated for the unamplified experiment are replicated in the plot of ratios generated by microarray analysis of amplified DNA.