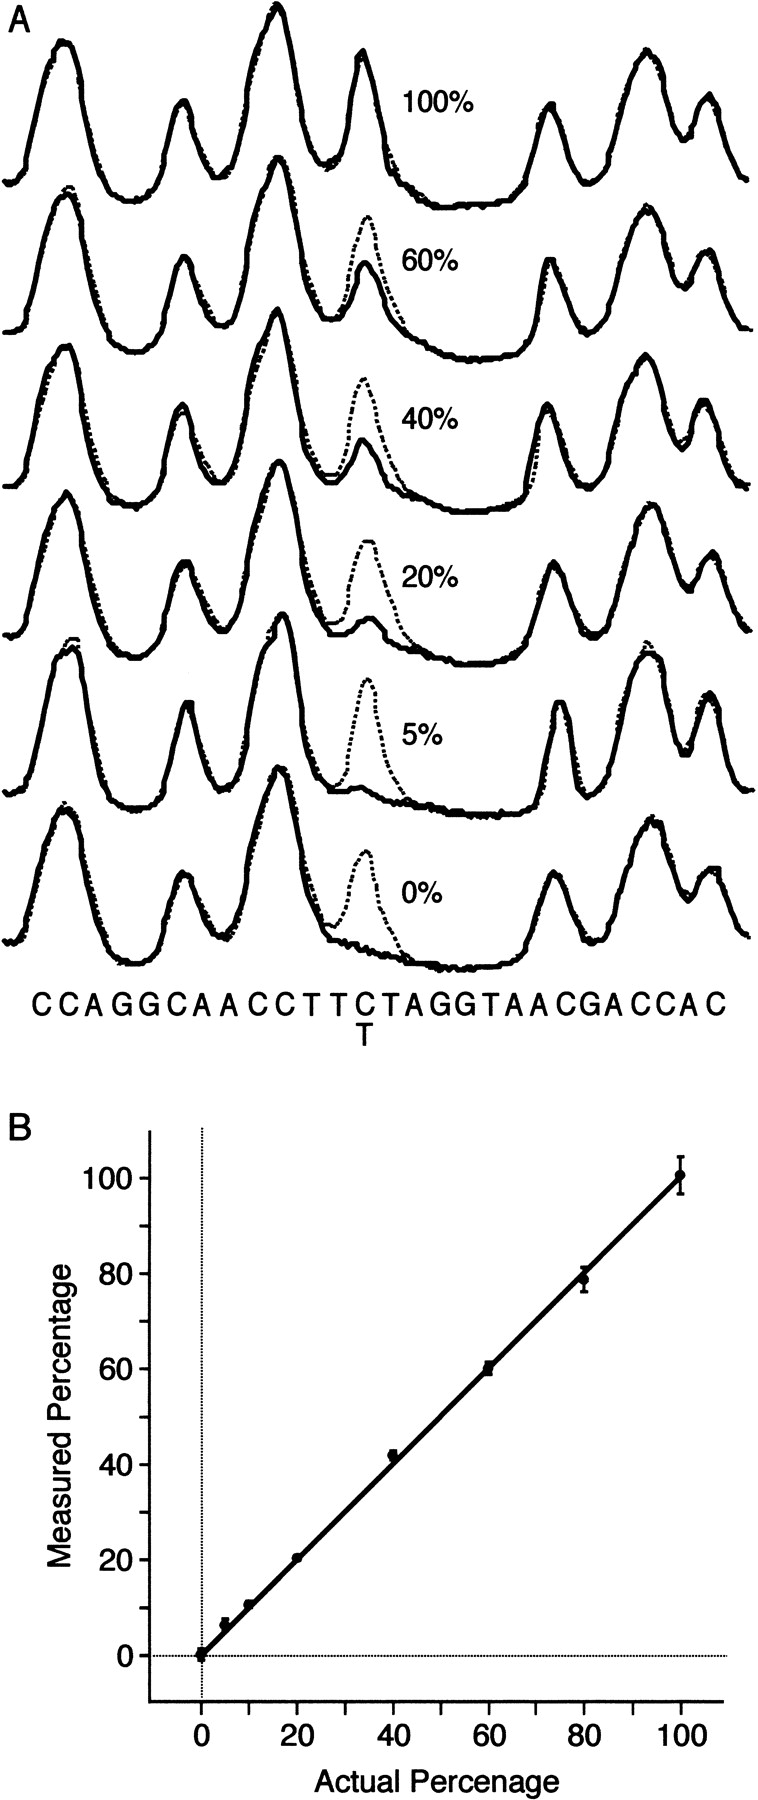
Figure 4.
Minor allele frequency limit of detection analysis in multiplexed samples. (A) Two-color PRS traces comparing a single individual reference (dotted) and a multiplexed sample (solid). Multiplexed samples contain varying ratios of C→T polymorphic templates. (B) Allele frequency calibration curve generated from 32 independent traces. Error bars indicate 99% confidence interval (R2 = 0.9991).