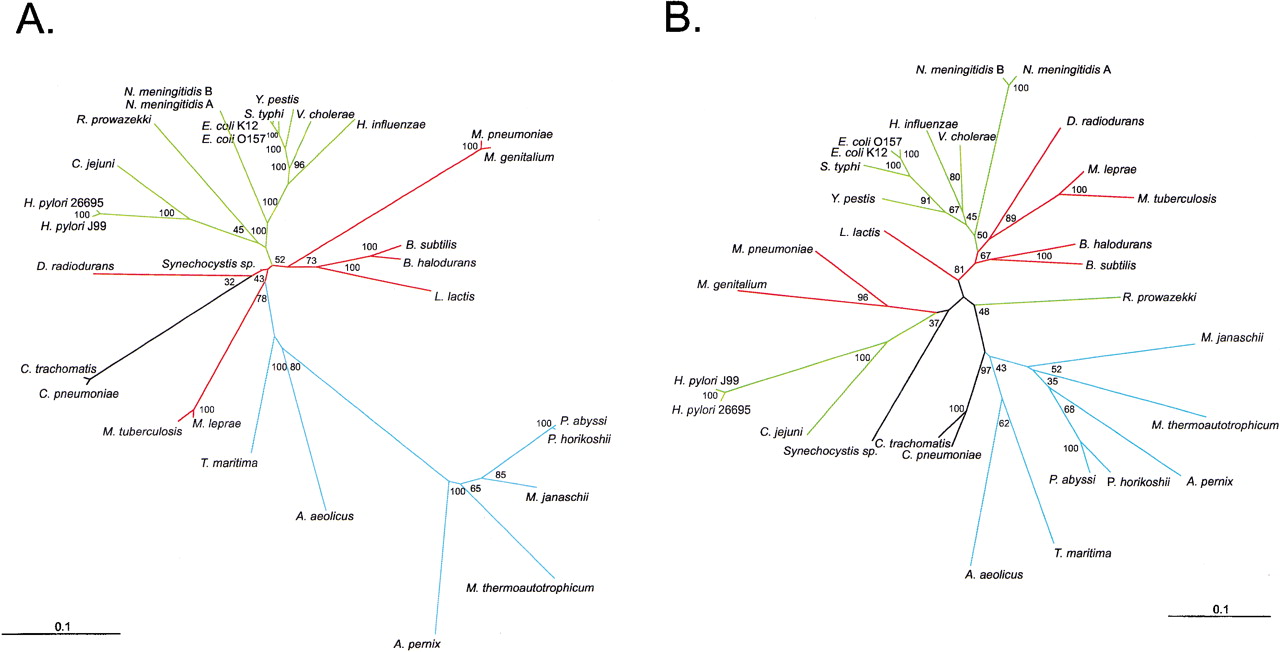
Figure 4.
Phylograms of 27 selected organisms for which genomic sequences are available. (A) 16S rRNA sequences were subjected to neighbor-joining analysis using HKY85 distance matrices. (B) The same organisms were grouped by using distance matrices based on the sums of the zero-order Markov F(W) differences from the other organisms for the 256 tetranucleotide combinations, and phylogenies created by neighbor-joining analysis. Bootstrap values based on 100 replicates are represented at each node, and branch length index is indicated in each panel. Gram-negative branches are indicated in green, Gram-positive in red, archaea and thermophilic bacteria in blue, and all other branches in black.