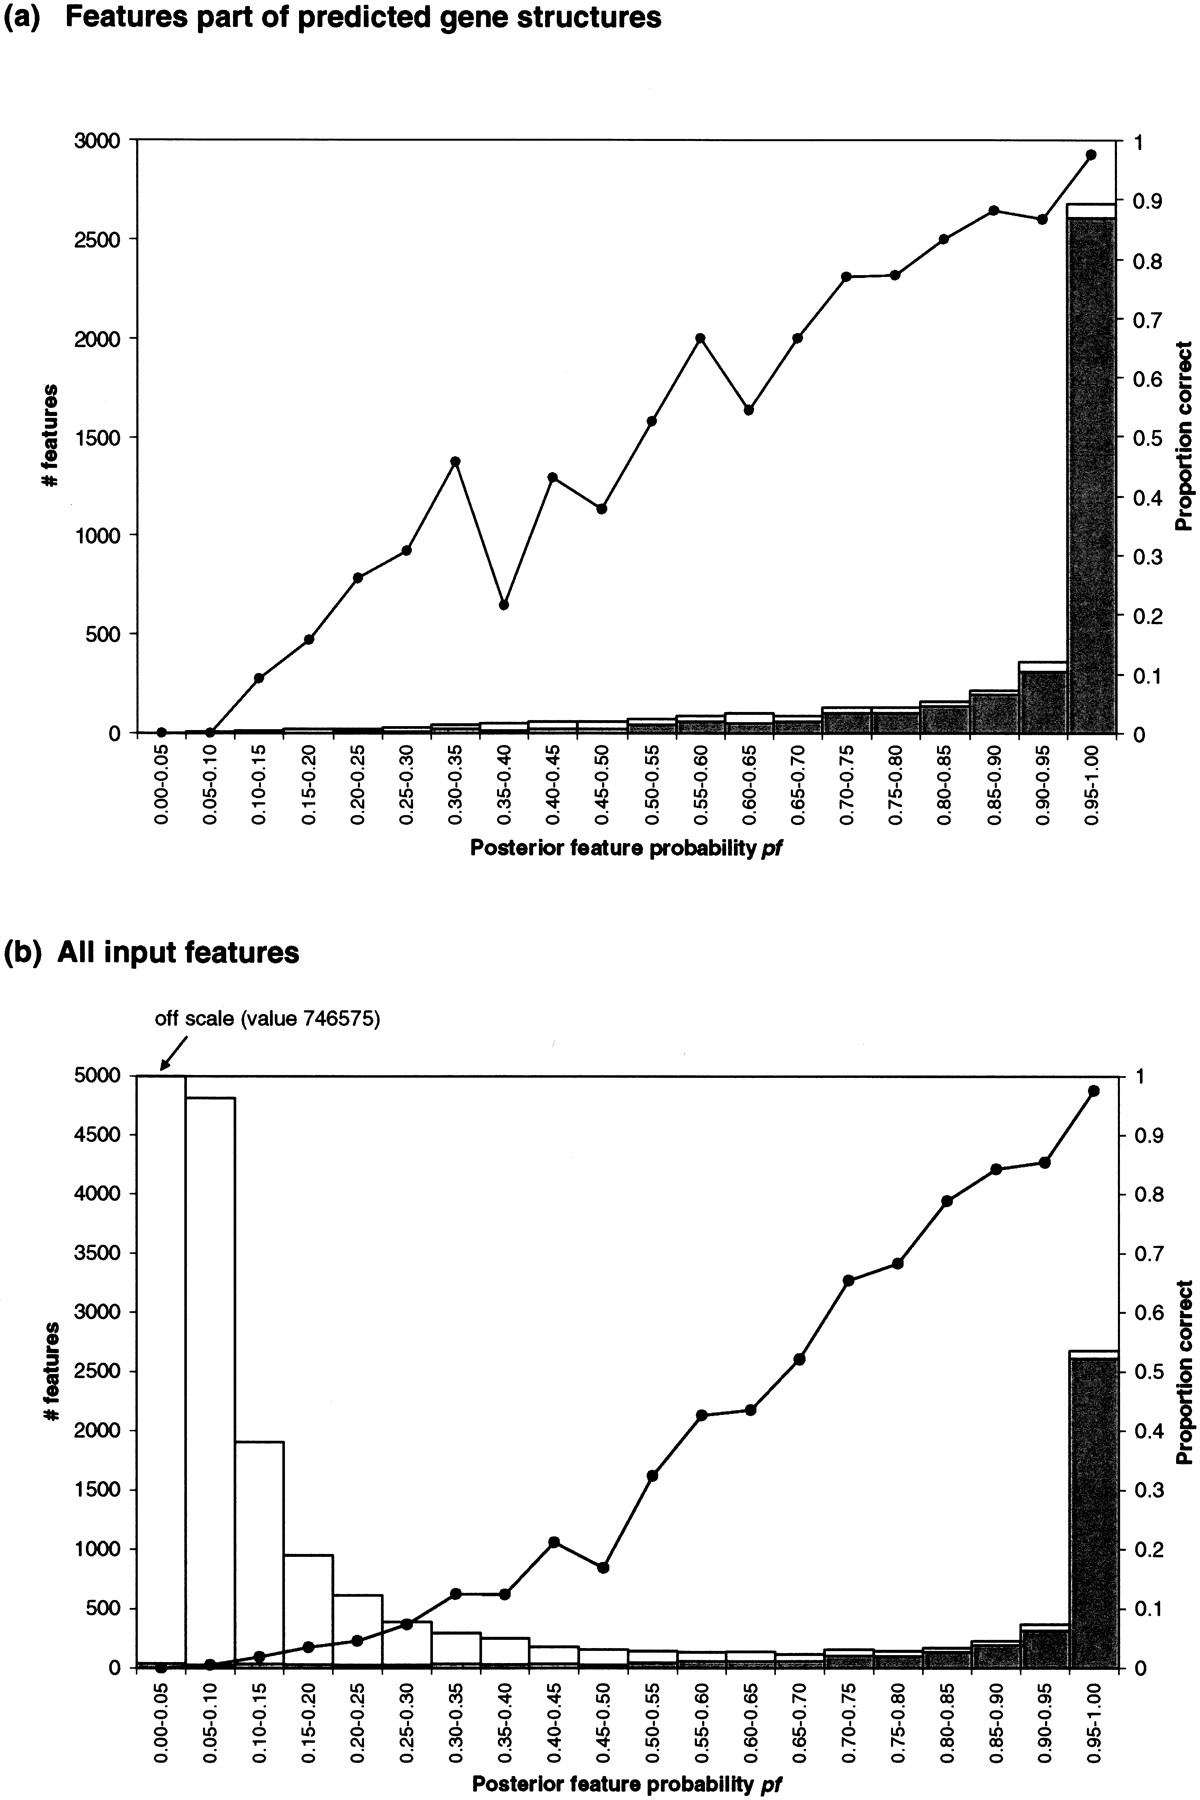
Figure 4.
Posterior feature probabilities and their accuracies. Shown for (a) features part of gene-structures predicted by GAZE and (b) all features given as input to GAZE are the number of features with a posterior probability, pf in each interval (bars), the number of those features that were correct (shaded portions of the bars), and the proportion of those features that were correct (line). These data were calculated for the GAZE_EST model. Plots for other models are similar (data not shown).