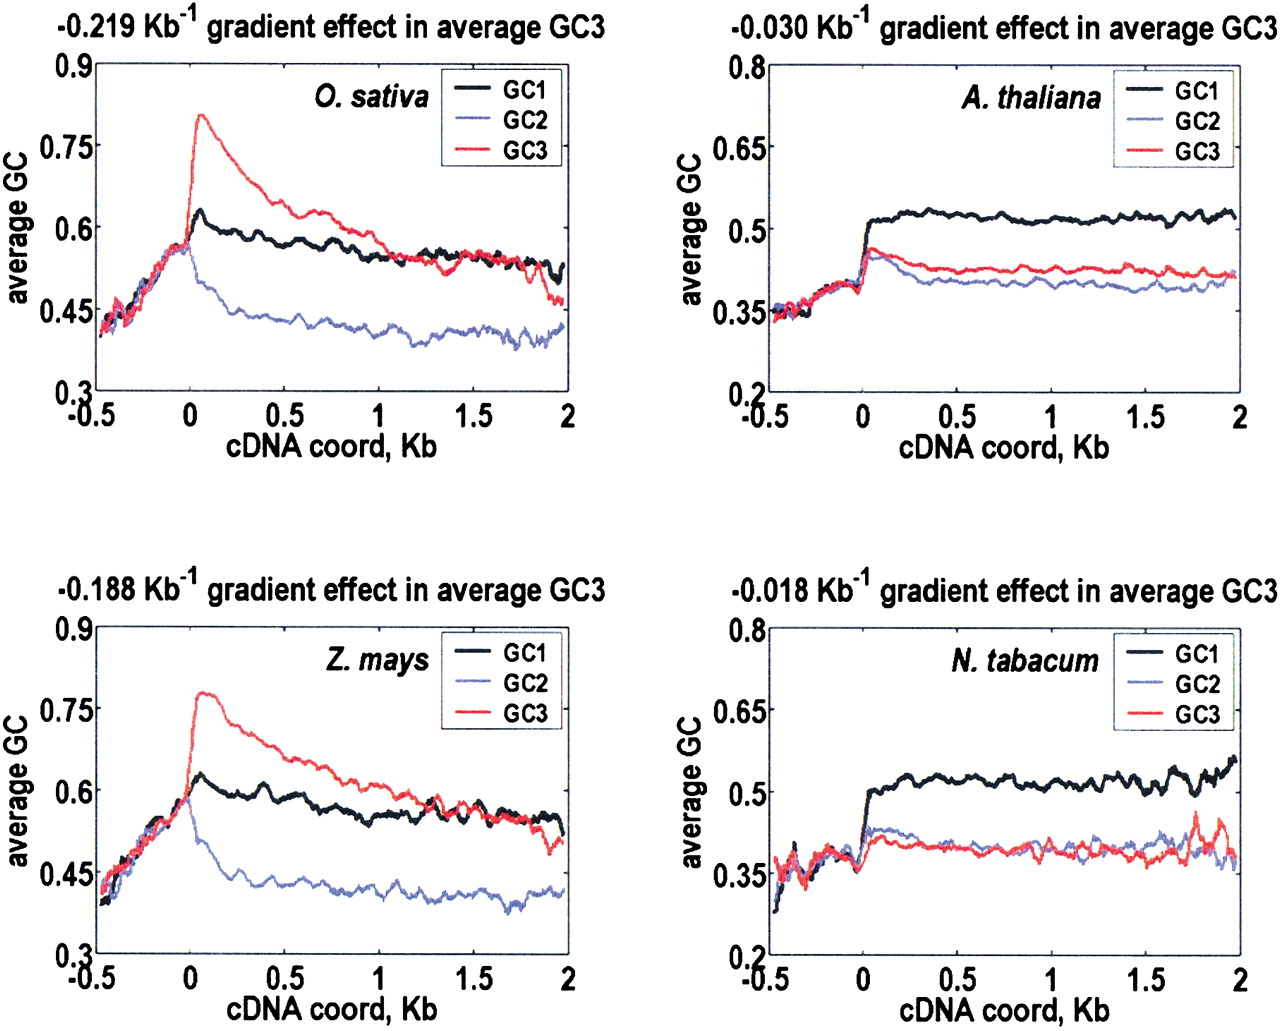
Figure 4.
GC1, GC2, and GC3 content as a function of cDNA position, relative to the start of the coding region, and averaged over all cDNAs with a 51-bp sliding window. Shown here are O. sativa, Z. mays, A. thaliana, and N. tabacum. Phase information is extended into the 5′-UTR.