Figure 4.
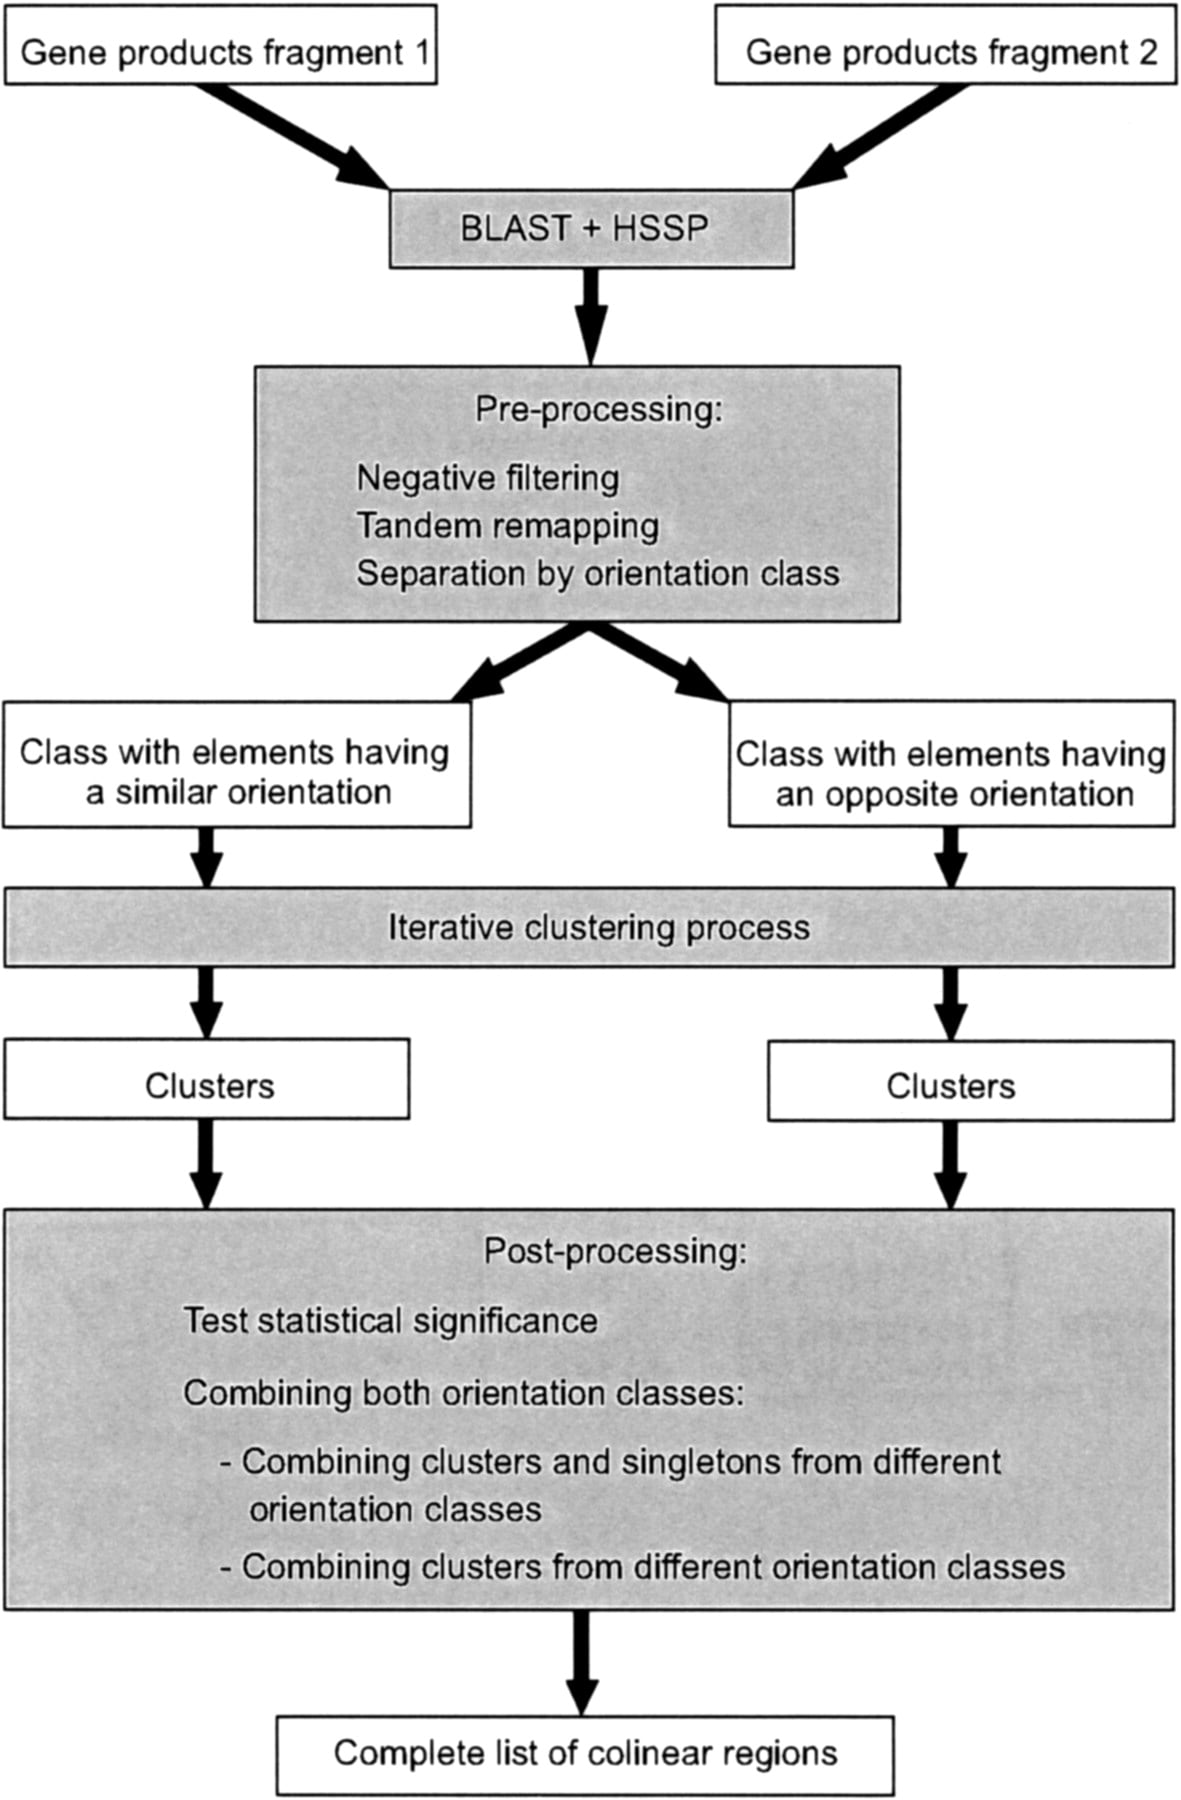
Flowchart of the ADHoRe strategy used to define colinear regions between two genomic fragments. White boxes represent data items, gray boxes represent routines, and arrows indicate the dataflow.
Flowchart of the ADHoRe strategy used to define colinear regions between two genomic fragments. White boxes represent data items, gray boxes represent routines, and arrows indicate the dataflow.