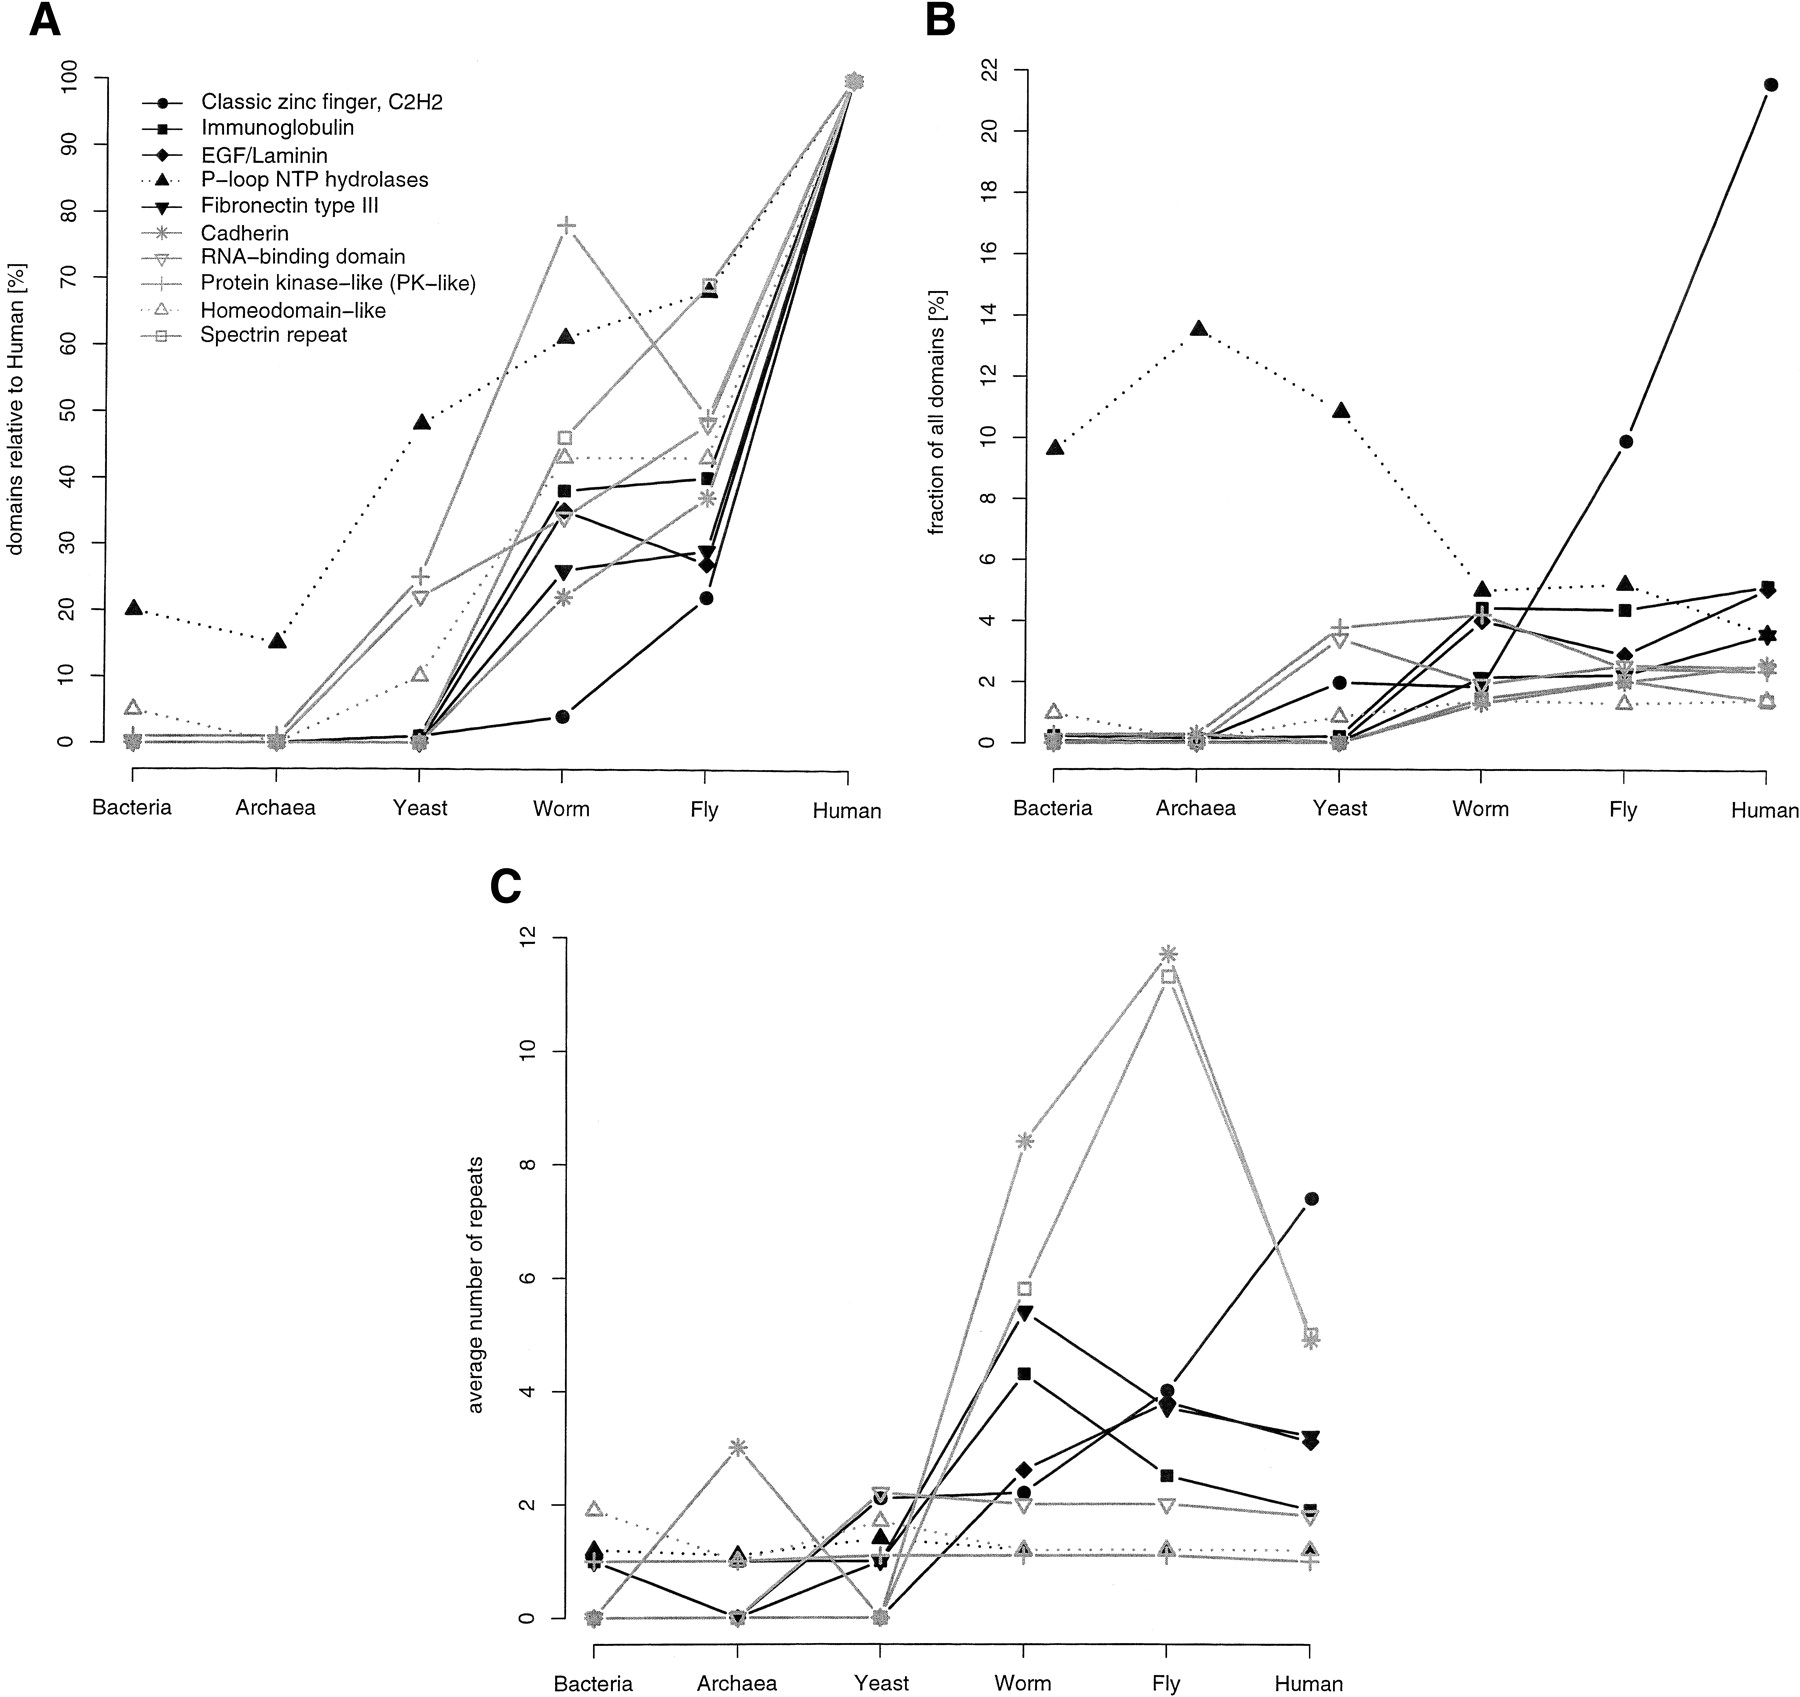
Figure 4.
Expansion of SCOP superfamilies. The 10 most abundant human superfamilies are shown. (A) Superfamily expansion relative to the human proteome. The expansion of a superfamily relative to the human proteome is plotted as the number of domains in superfamily X in proteome Y divided by the number of domains in superfamily X in human (times 100), so that all superfamilies are 100% in human. (B) Relative superfamily expansion. Number of domains in a superfamily normalized by the number of domains in all superfamilies for a proteome (multiplied by 100). (C) Average repetitiveness of superfamilies. For each superfamily, the number of domains divided by the number of sequences this superfamily is found in is plotted.