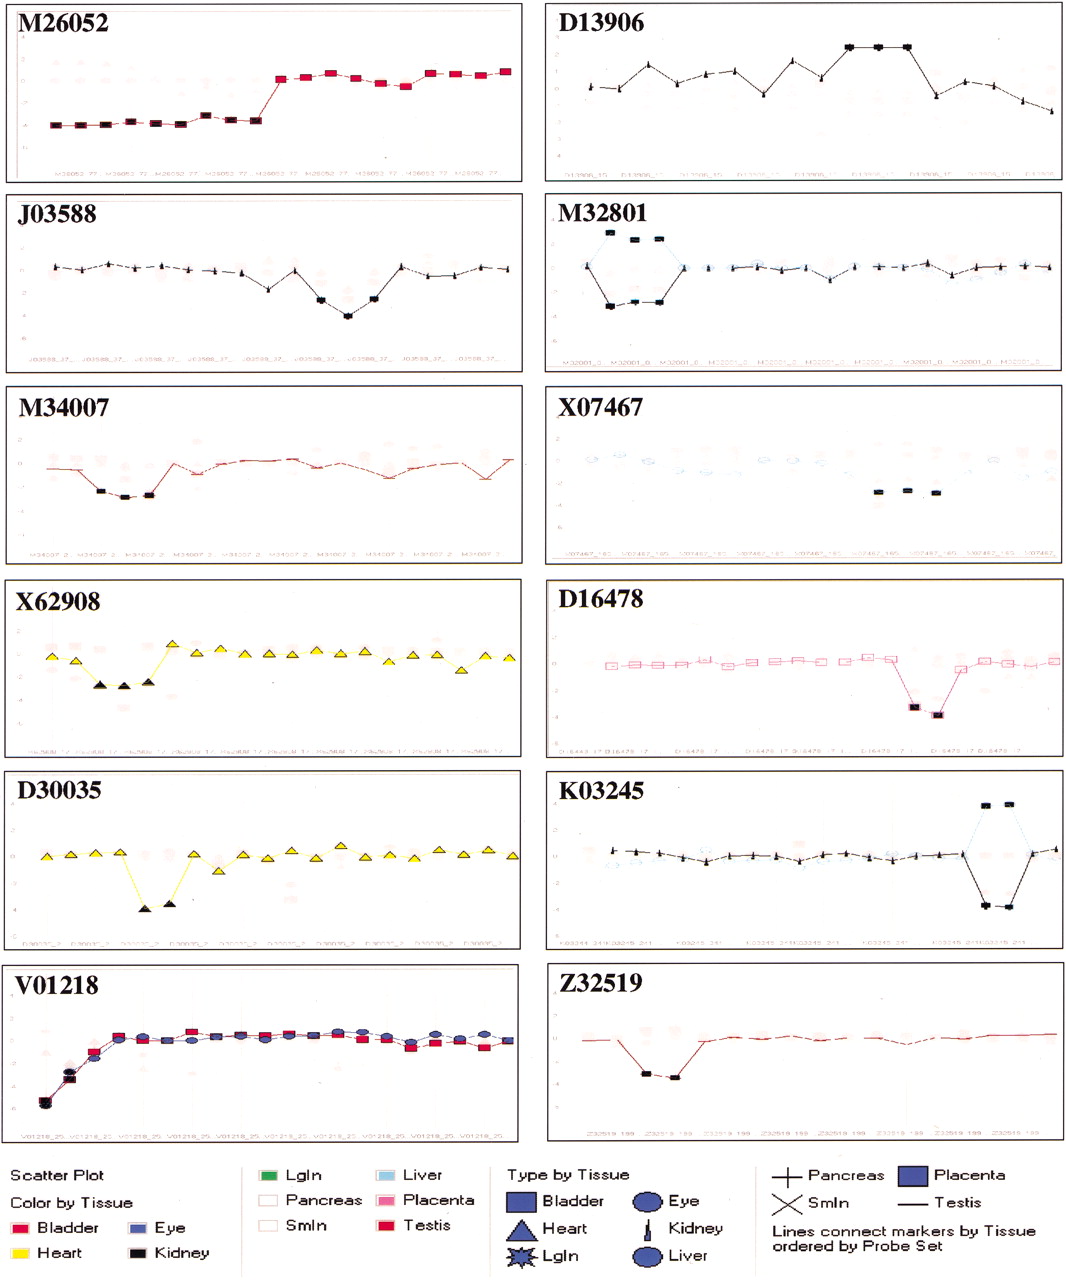
Figure 4.
Visualization of predicted splice variants from 10 normal rat tissues. FR values for predicted probe sets in Table 3 were visualized as 2-D line graphs. In each graph, The X-axis represents the order of the probe set and the Y-axis represents FR value. The tissue types are represented by different shapes as indicated. The type of tissue containing the predicted splice variant is highlighted and the probes are indicated by filled dark rectangles.