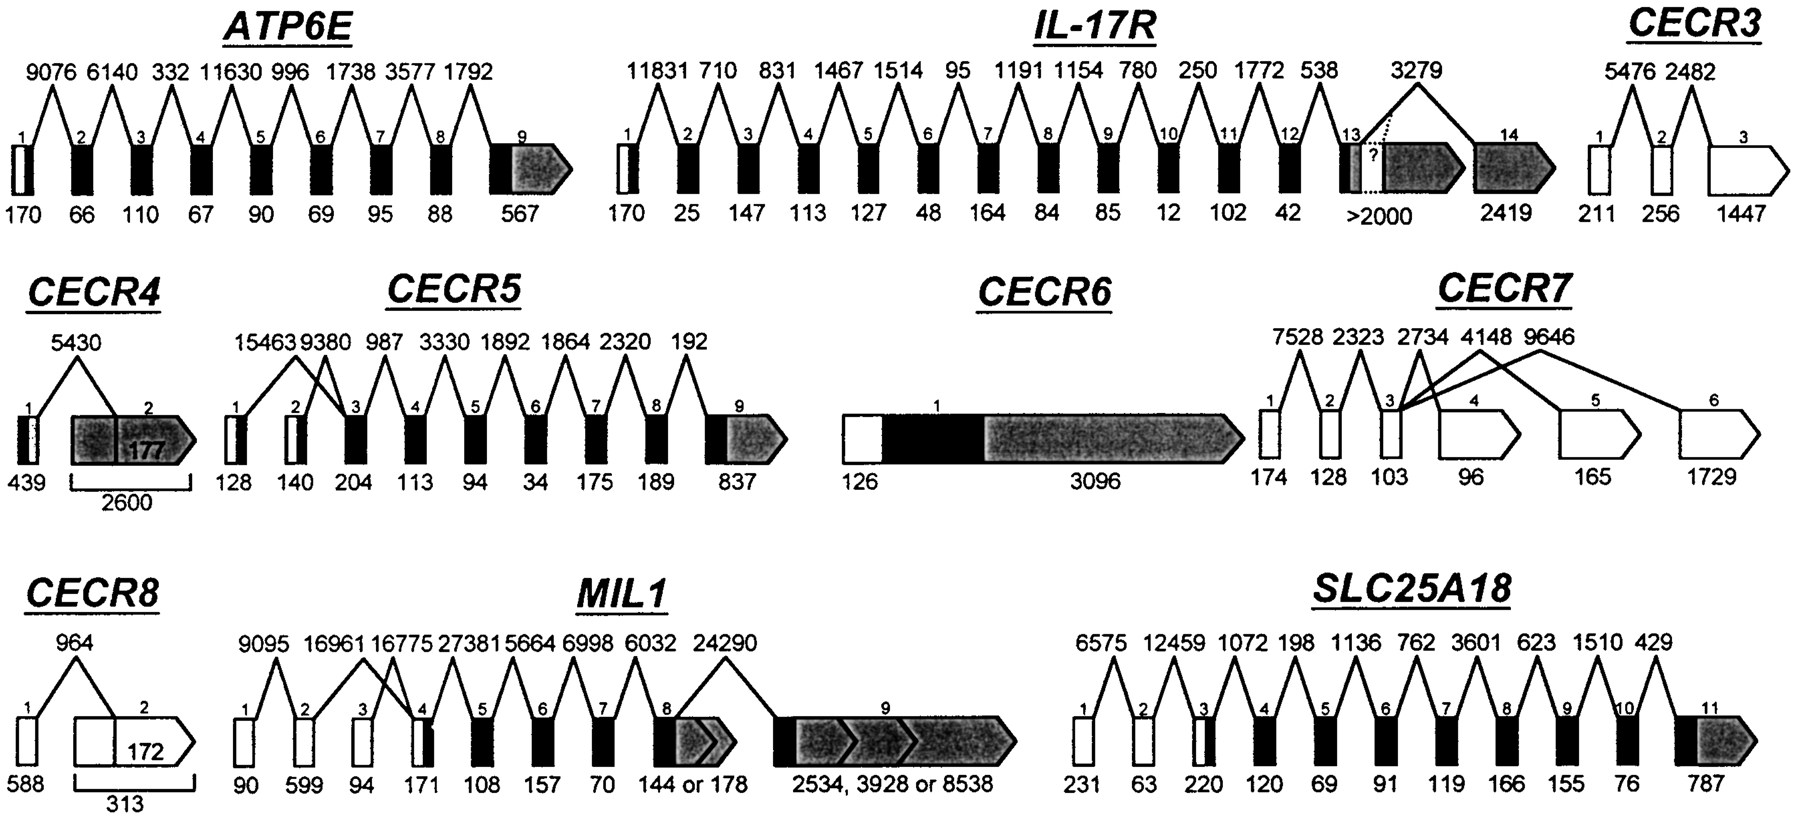
Figure 4.
Genomic structure of the genes in the CES critical region (CESCR). Exons and introns are not shown to scale, but sizes in bp are given below the exons and above the introns. Exons are numbered from the 5′-most cloned exon; additional undiscovered exons may exist. ORFs are shown in black, 5′ UTRs in white, 3′ UTRs in grey. No significant ORFs have yet been predicted for CECR3, CECR7, orCECR8, hence all the exons are shown in white. Only one exon of CECR9 is currently known, therefore it was not included in this figure. CECR1 and BID were published previously (Footz et al. 1998; Riazi et al. 2000). CECR2 will be published elsewhere.