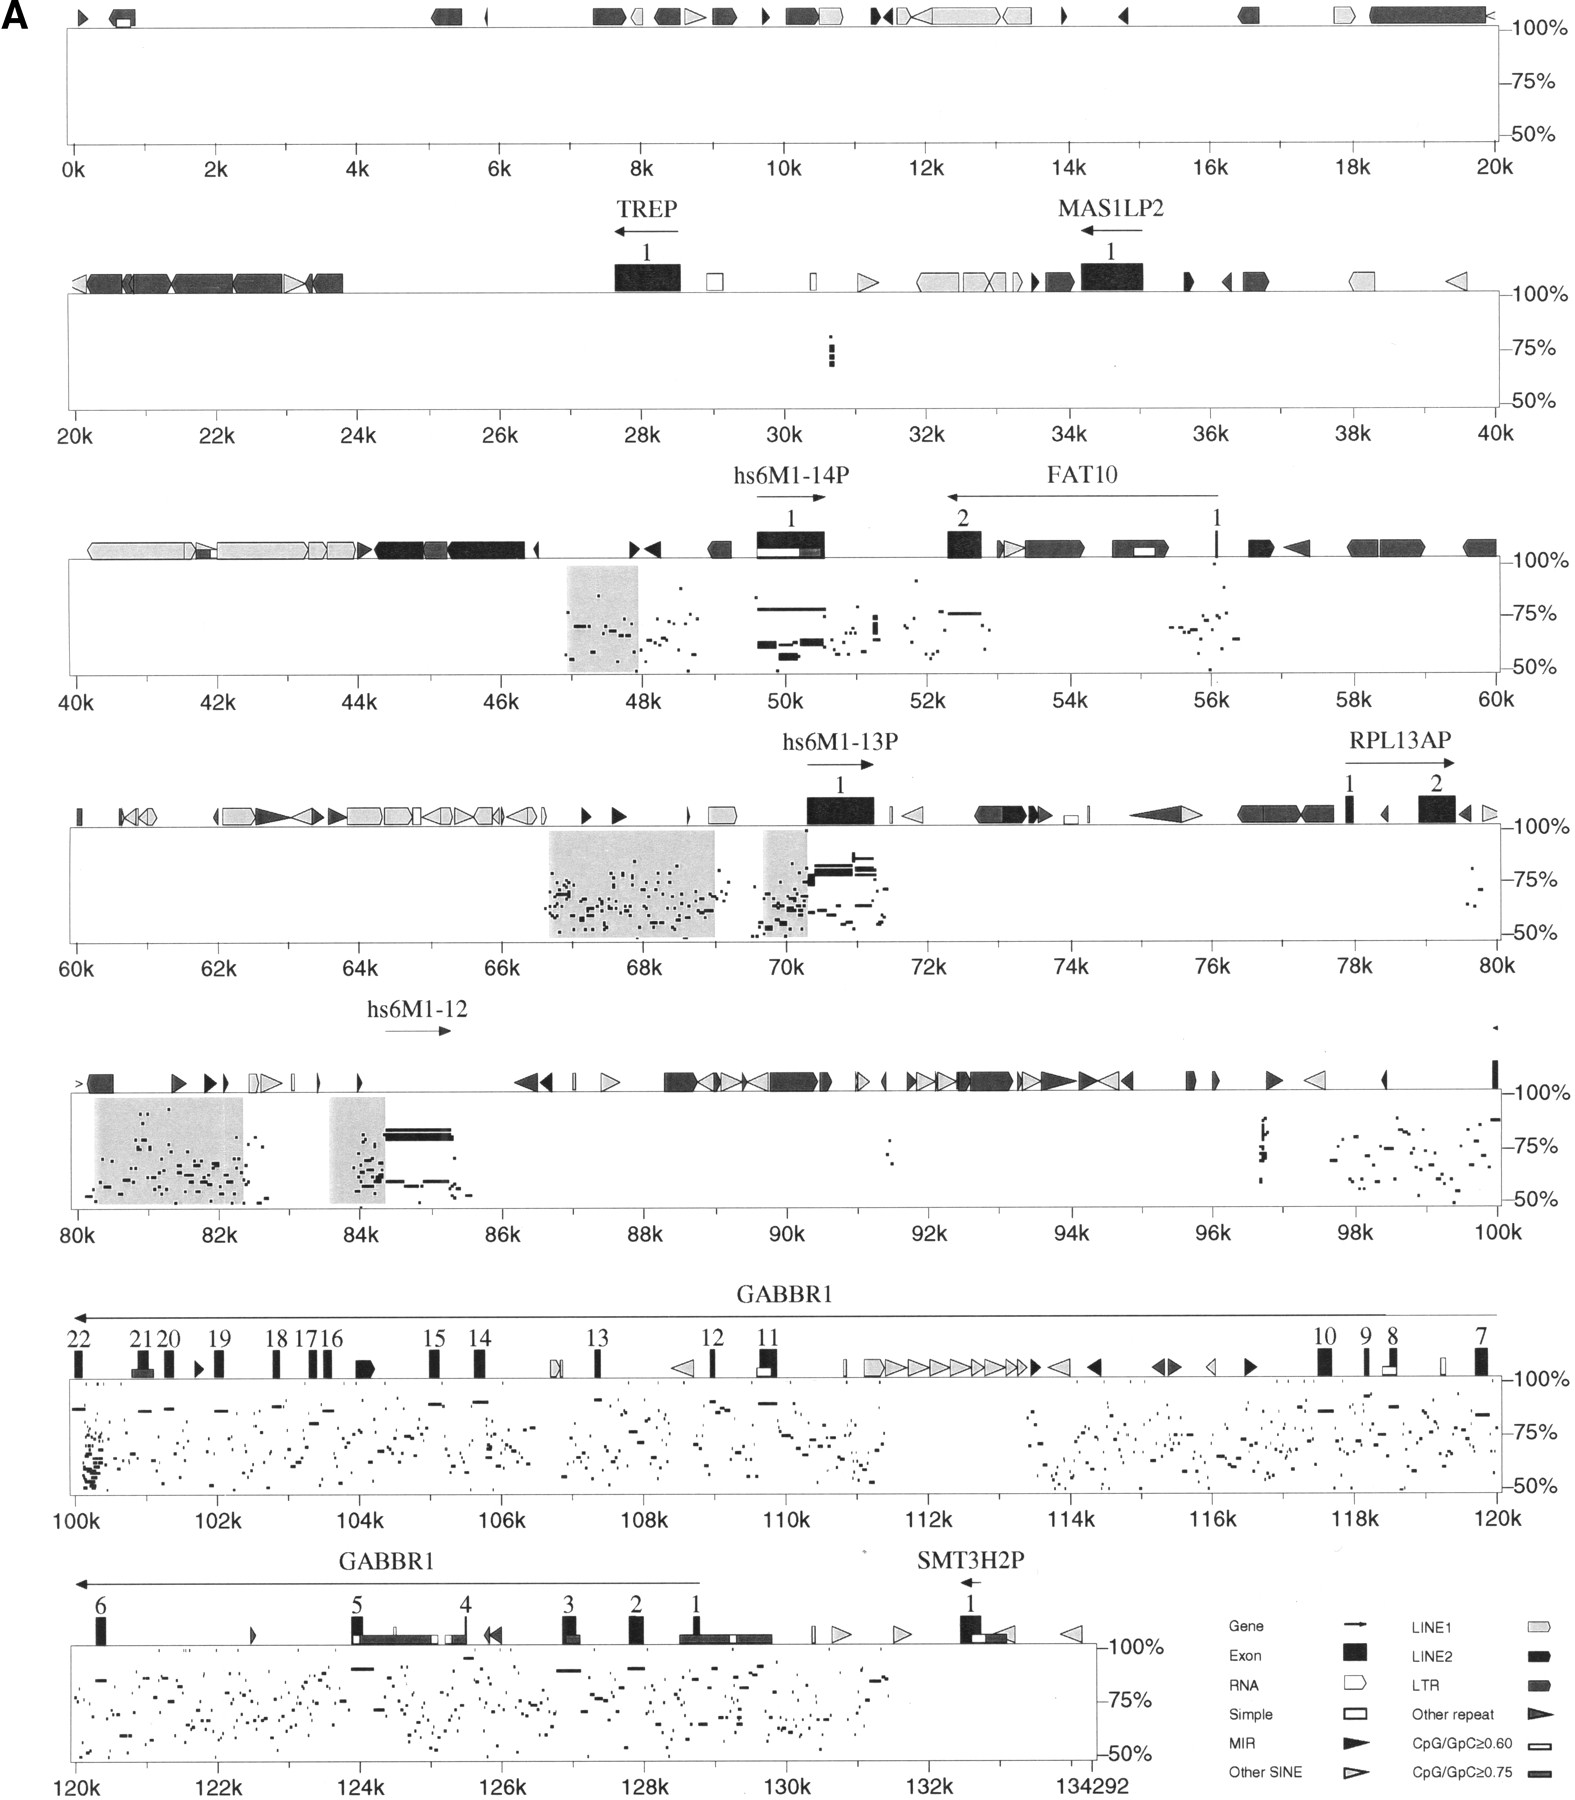
(A) Percent identity plot (PIP) of the human-mouse comparison for the centromeric boundary of the MHC-linked olfactory receptor (OR) gene cluster. The two sequences used are accession no. AL031983 for the human sequence and accession no. AL078630 for the mouse sequence. The human sequence was used as the subject sequence and is annotated along the top line. Regions between 50% and 100% conservation to mouse are plotted under the corresponding human positions. The grey shaded boxes mark conserved regions possibly involved in the regulation of the corresponding OR loci. (B) Schematic summary of the human-mouse comparative analysis. OR loci are shown as black boxes and non-OR loci as white boxes. Orthologous gene loci are connected by dotted lines. 'cen' and 'tel' define directions towards centromere and telomere, respectively.