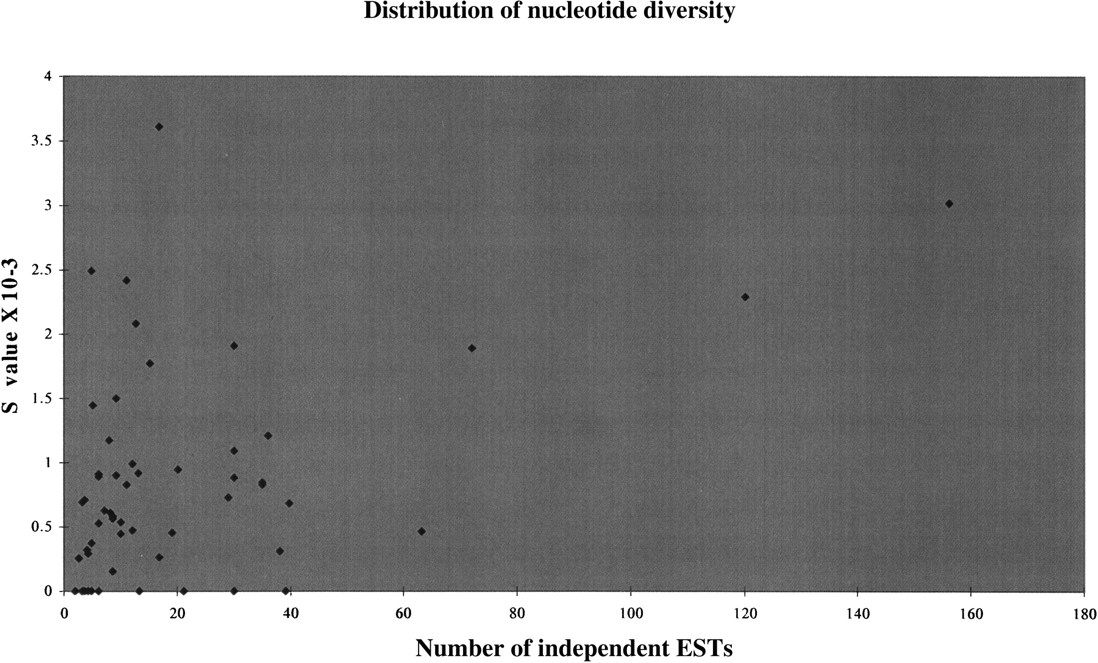
Figure 4.
The graph shows the distribution of the observed nucleotide diversity against the number of independent ESTs. The correlation coefficient is 0.47. The S value corresponds to the number of cSNPs per nucleotide.
The graph shows the distribution of the observed nucleotide diversity against the number of independent ESTs. The correlation coefficient is 0.47. The S value corresponds to the number of cSNPs per nucleotide.