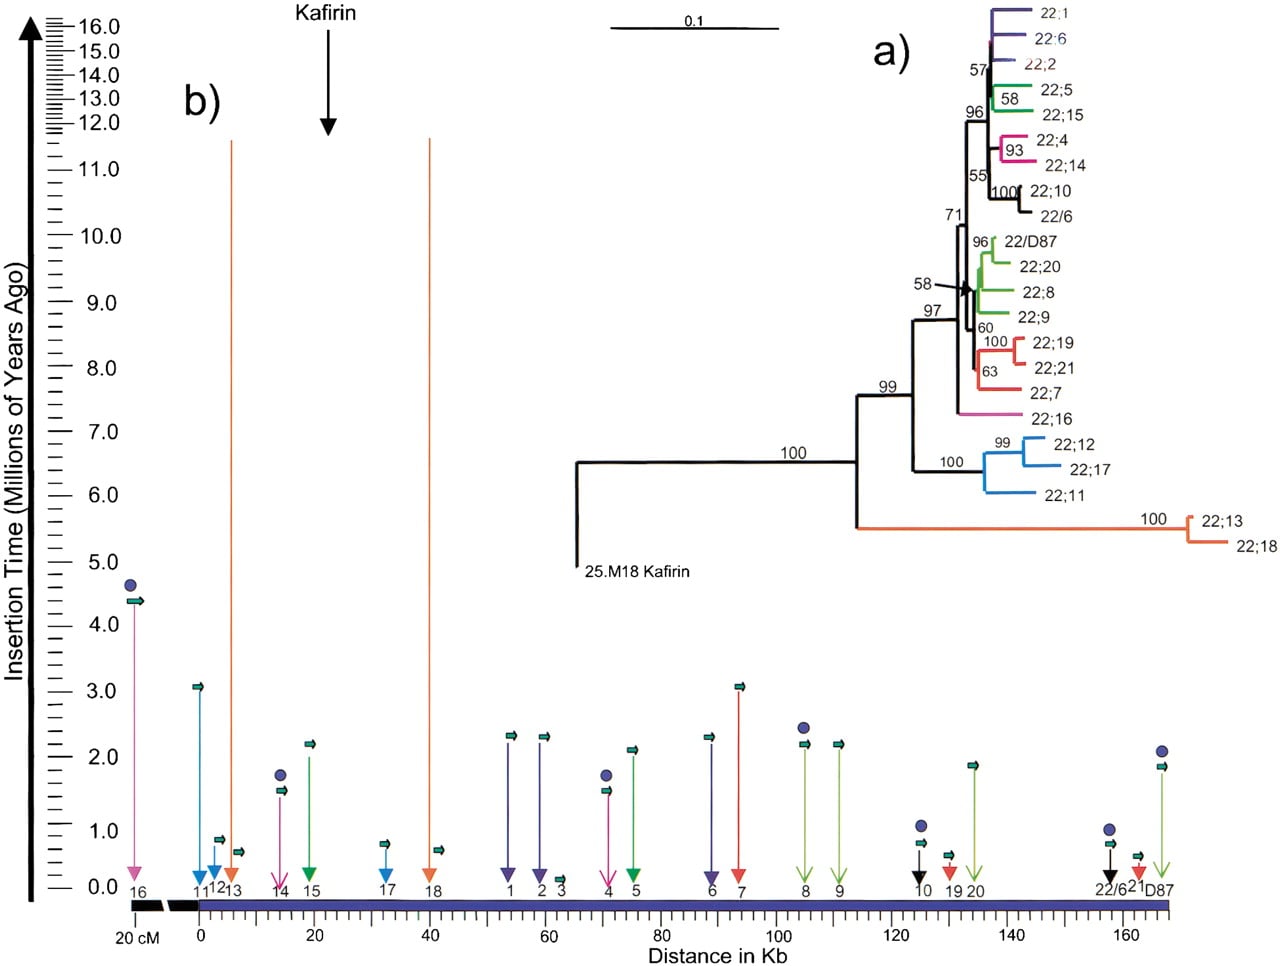
Distance analysis of the 22-kD α zein gene sequences from BSSS53. (a) A phylogenetic tree (see Methods section) has been inserted in the right corner. Gene names are abbreviated as22;n instead of azs22;n. The coding sequences of all 22-kD α zein genes except for azs22;3 are represented in the tree. The azs22;7 sequence has been derived by subtracting an insertion sequence. Bootstrap numbers are shown above or at the internodes. The tree scale bar represents 10% divergence. (b) The estimated divergence time of each α zein gene (millions of years) vs. point of insertion (kb) is shown. Small green arrows represent the different copies of the zein genes; active copies have a blue dot above them. Phylogenetically related zein copies have identical arrows (color and head style) corresponding to the colored tree branches. The positions of green arrows for azs22;13 and azs22;18represent their recent divergence, whereas the orange arrows represent their origin. Genes from the same clade have been color coded to illustrate that amplification did not occur in a simple physical order.