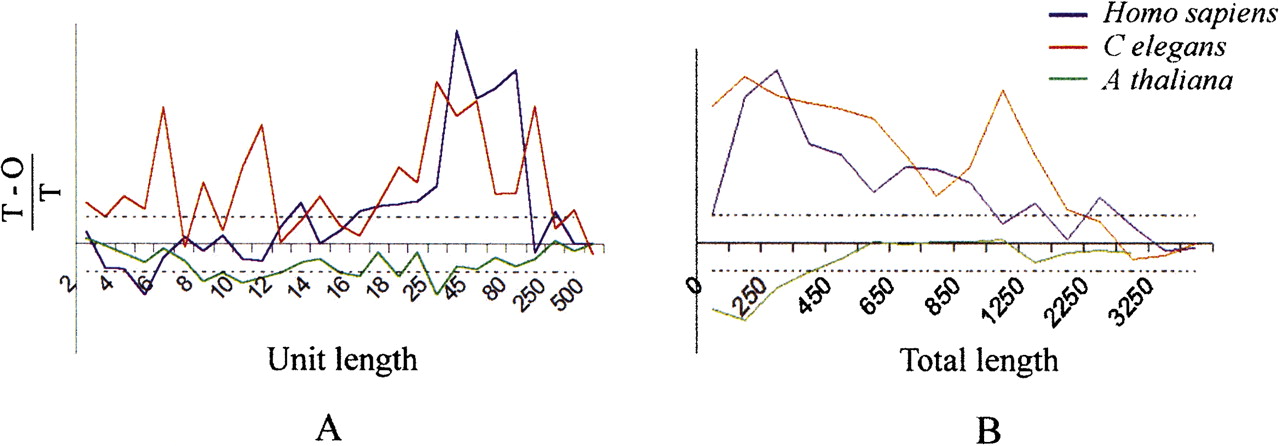
Figure 4.
Comparison between terminal and other regions according to unit length (A) or total length (B). On Y-axis: {number of objects in the terminal 10% of the sequence [T] − number of object in other regions [mean for 10%] [O])/O (corresponds to a Z-score). If >0, terminal 10% are richer than the rest of the genome; else they are poorer, with a significance threshold of 1.96 (dotted lines). On X-axis: unit length (A) or total array length (B).