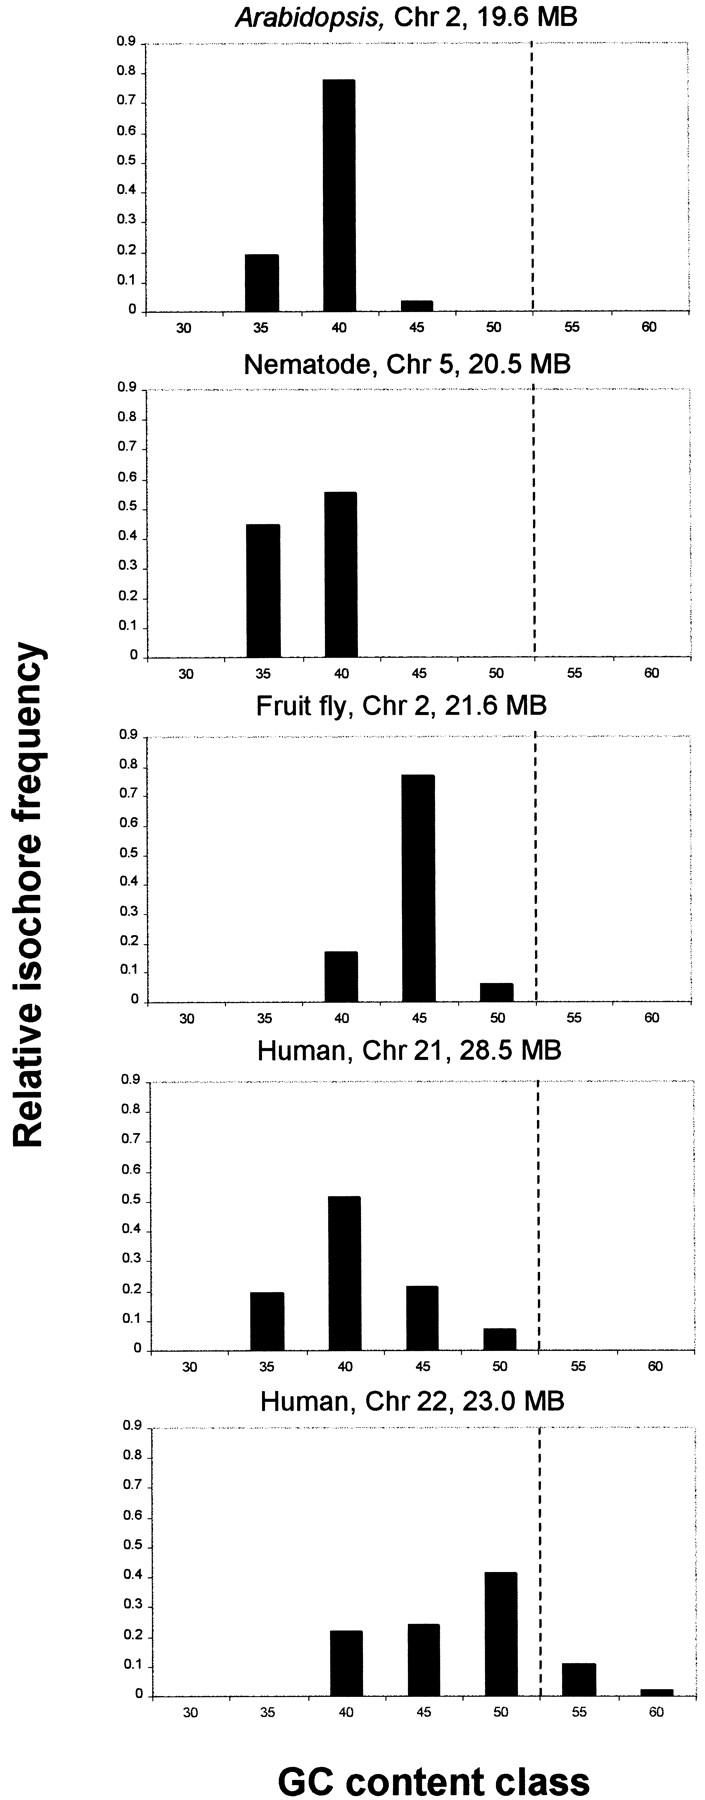
Figure 4.
The relative frequencies of isochores falling into distinct GC content classes. To construct this figure, all isochores that are ⩾100 kb and are homogeneous at 7% fluctuation level were ordered according to their GC content into seven classes using the 5% GC bin size. The broken line separates GC content classes that are unique for the human genome.