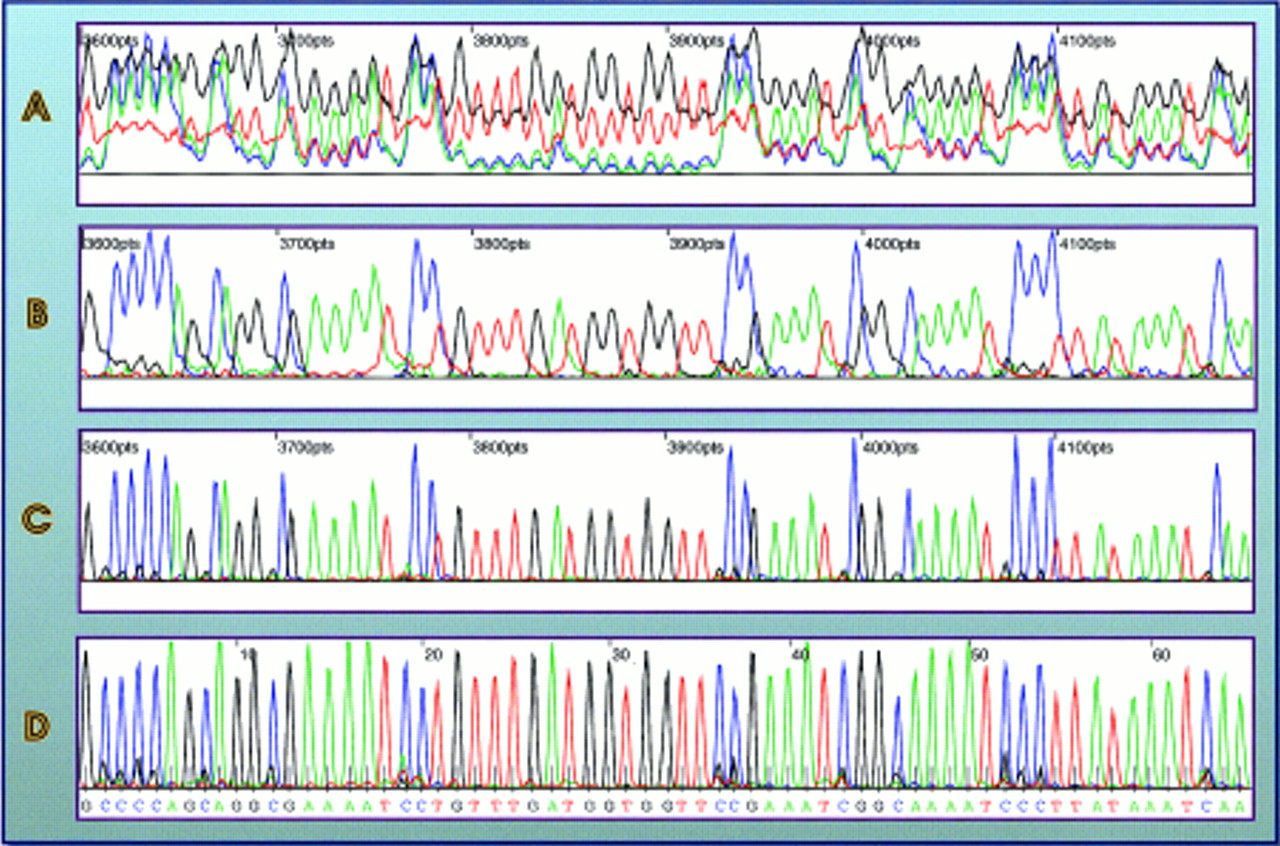
Figure 3.
Shown is a short region of trace data extracted from an M13mp18 sequencing experiment performed on the scanning electrophoresis system developed in our laboratory. The data are shown in four different subsequent states of processing: (A) “raw” data as it looks after extraction from a lane by GelImager; (B) data after multicomponent transformation and noise filtering; (C) data after the addiction of a deconvolution step; and (D) data after the addiction of a polynomial mobility-shift correction, histogram cutoff adjustment, normalization, and base-calling.