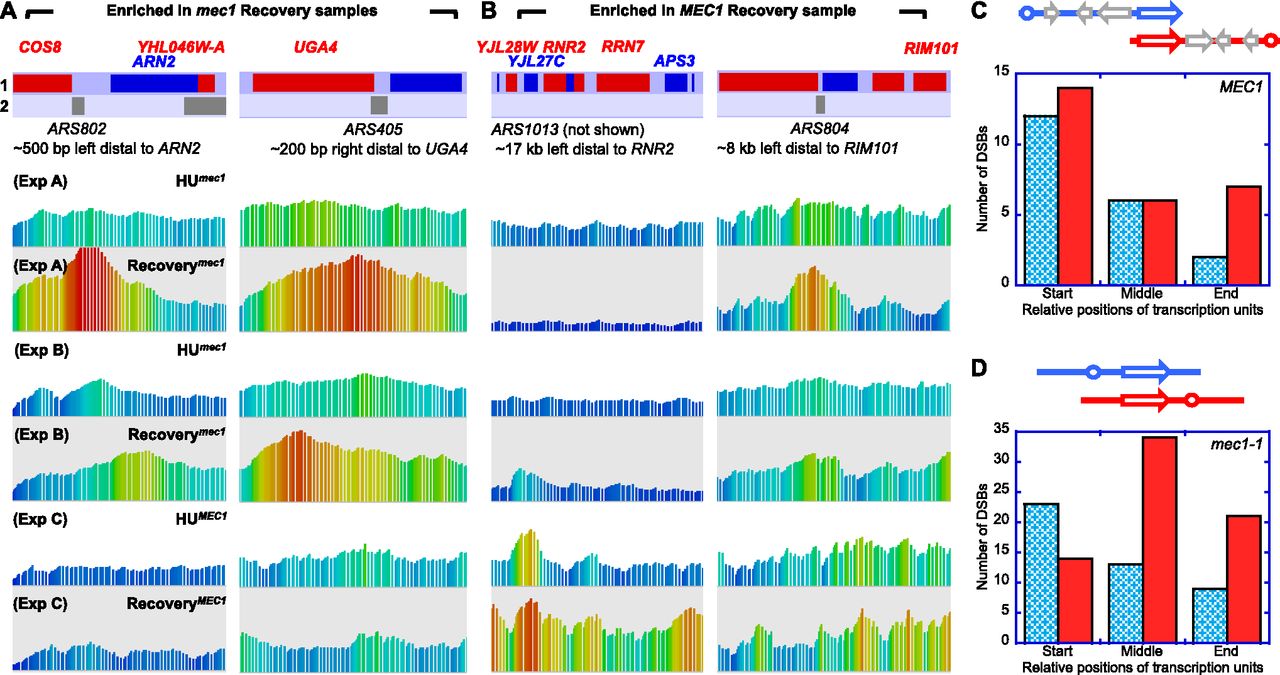
Examples of genomic loci containing enriched DSBs in mec1 (A) and MEC1 (B) cells. The annotation tracks are gene (1), labeled red and blue for Watson- and Crick-strand-encoded, respectively, and origins of replication (2). ORF names and ARS numbers are as labeled and centered on the marker in each track. The data tracks are as labeled. Only those genes that overlap with the enriched DSBs are named (OCA5 and WSC4 at the ARS804 locus not shown). A dubious ORF and two tRNAs at the RNR2 loci are not labeled due to space restriction. Distribution of enriched DSBs with respect to genes in MEC1 (C) and mec1 (D) cells. All DSB-associated genes, in either codirectional (blue) or convergent (red) orientation with respect to replication from the nearest origin (circles similarly color-coded in the two orientations) were aligned at the start codon and normalized by size. Genes (gray) in the intervening region between the origin and DSB-associated gene are illustrated to indicate the longer gene-to-origin distance in MEC1 cells. The numbers of DSBs occurring at the relative positions of each gene were reported for the codirectional (blue) or convergent (red) groups in histograms.