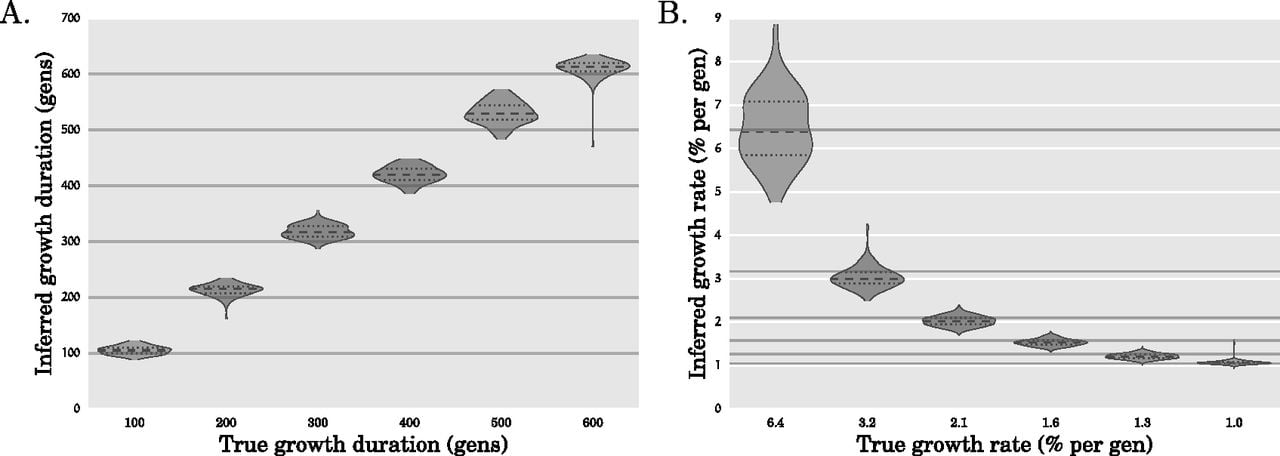
Performance of fastsimcoal (Excoffier et al. 2013) on simulated data for Scenario 1. Panels A and B, respectively, show violin plots of the inferred duration and rate of exponential growth in the population size for 100 simulated data sets for each of the simulation parameter settings in Scenario 1. These are the same simulated data sets used to generate Figure 2, A and B and Supplemental Figure S1. The gray solid horizontal lines indicate the true values for the simulation parameters. When applying fastsimcoal, due to computational reasons we used 200 and 500 coalescent tree simulations for Scenario 1 and Scenario 2 per likelihood function estimation and limited the number of rounds of conditional expectation maximization (ECM cycles) to 40. On one of these 100 simulated data sets, their method appeared to have a runaway behavior and produced unreasonable estimates after 40 ECM cycles; this data set was excluded from these plots.