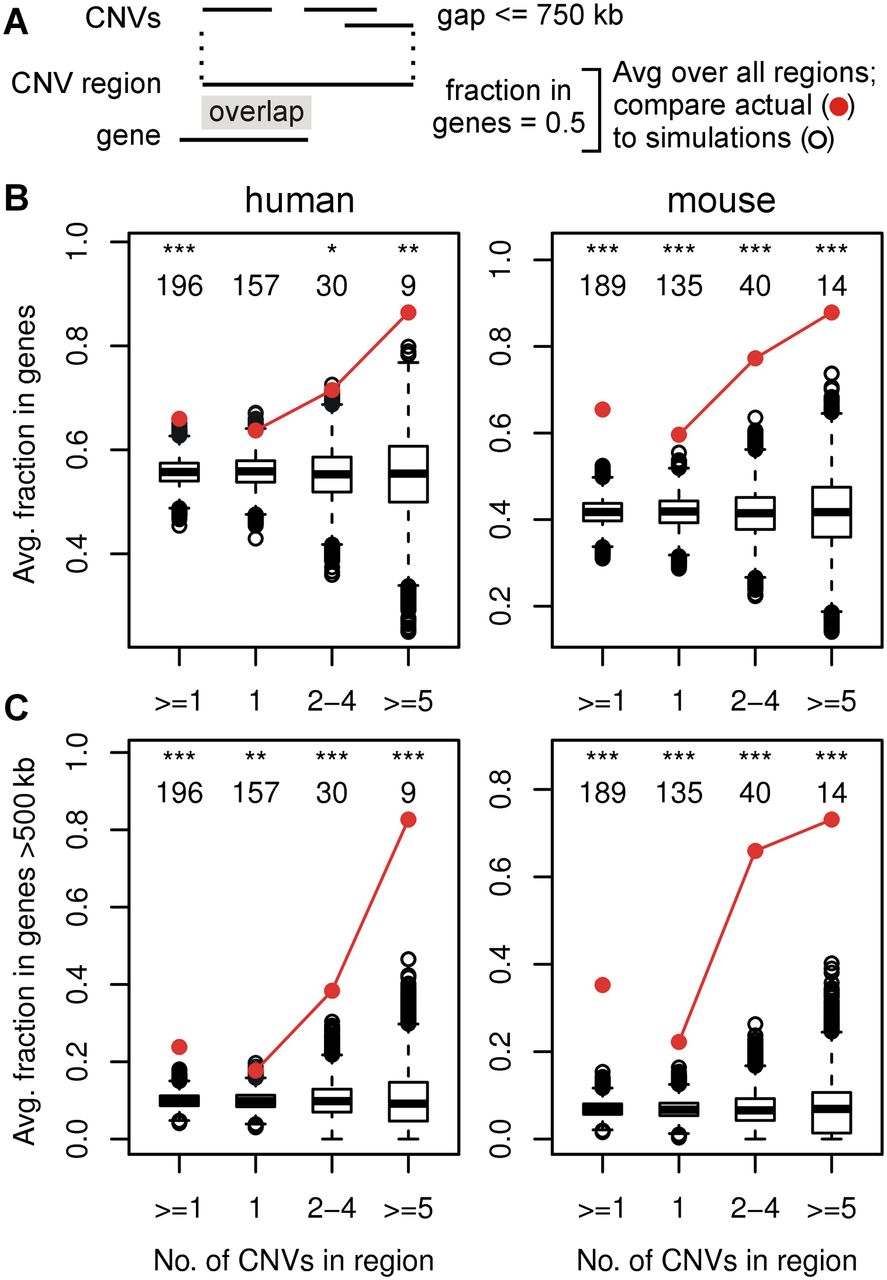
Figure 3.
CNV hotspots are enriched in large genes. (A) Methods used to merge CNVs into CNV regions and assess overlap with genome features. (B,C) Enrichment plots for the fraction of CNV regions in genes and genes >500 kb, respectively, for human 090 fibroblasts (left panels) and mES cells (right panels). Red circles show the actual average values for the indicated CNV region groups. Box and whisker plots show the distribution of averages over all simulation iterations. The number of CNV regions in each group and significant differences between the actual value and iteration distributions are indicated: (*) P < 0.01; (**) P < 0.001; (***) P < 0.0001. See Supplemental Figure S3 for additional enrichment plots.