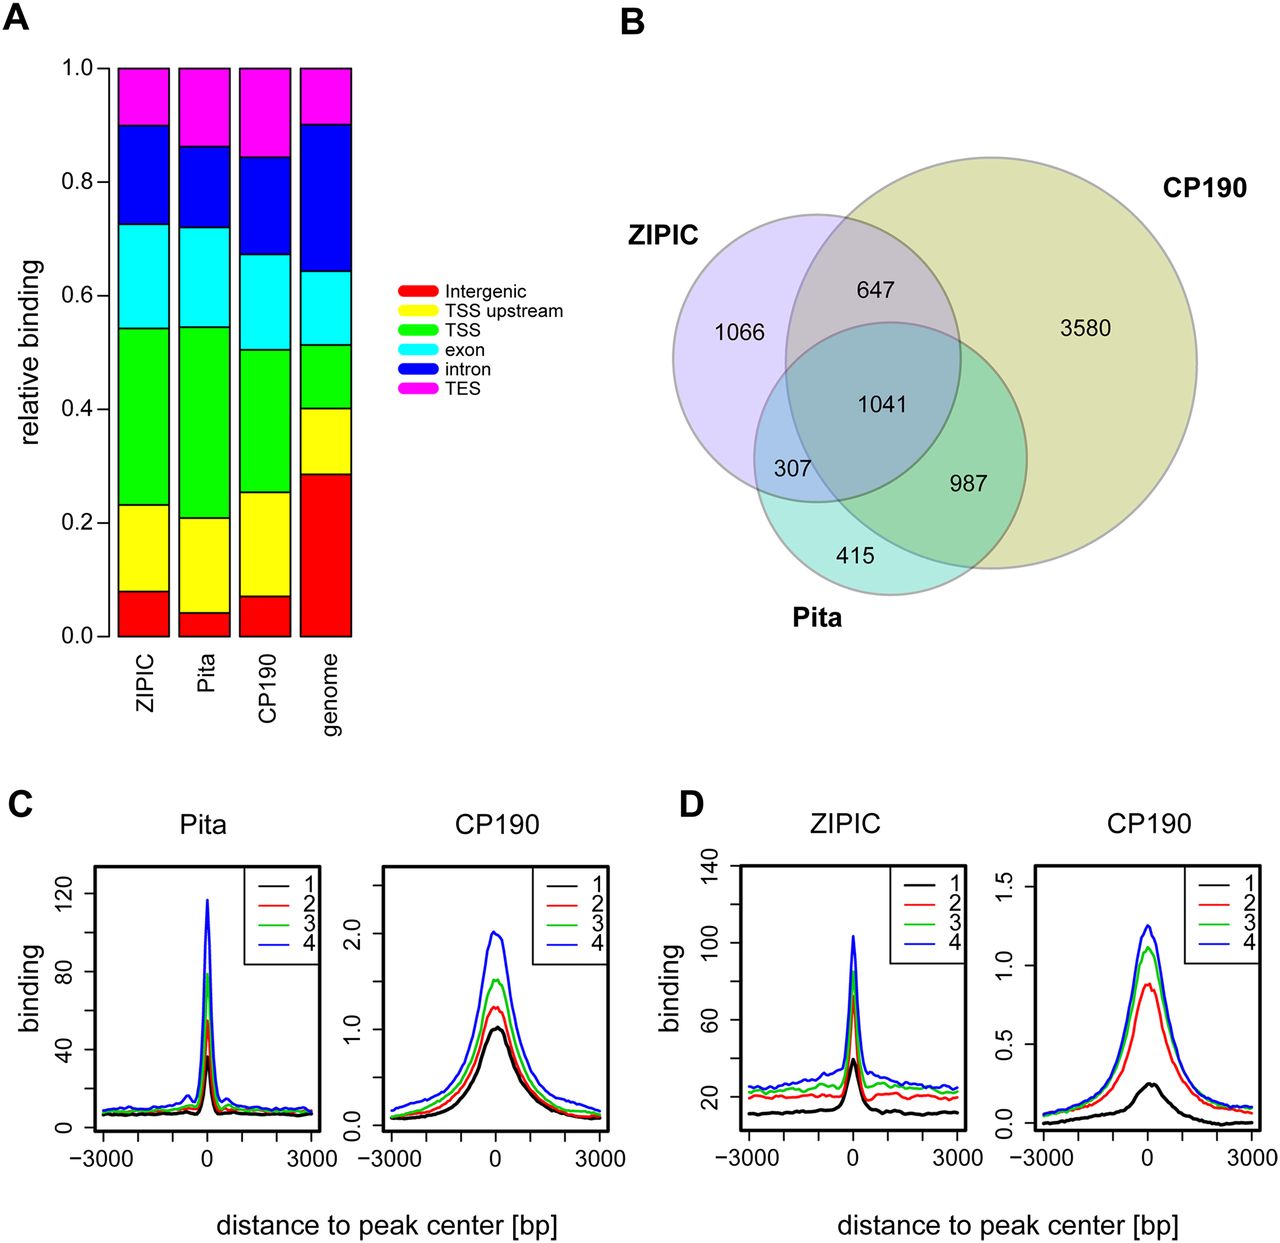
Figure 3.
Colocalization of CP190 with Pita or ZIPIC. (A) Distribution of genomic elements across regions of significant Pita, ZIPIC, and CP190 binding compared to their background distribution in the genome: ([green] TSS; [yellow] TSS upstream; [light blue] exon; [dark blue] intron; [purple] TES; [red] intergenic sites). (B) Venn diagram of the overlap between Pita, ZIPIC, and CP190 peaks. (C,D) Pita or ZIPIC binding regions were divided into four groups with respect to binding strength, from the lowest (1) to highest (4), and the average profiles for Pita (C) and ZIPIC (D) were plotted next to the average CP190 signals across the same sites.