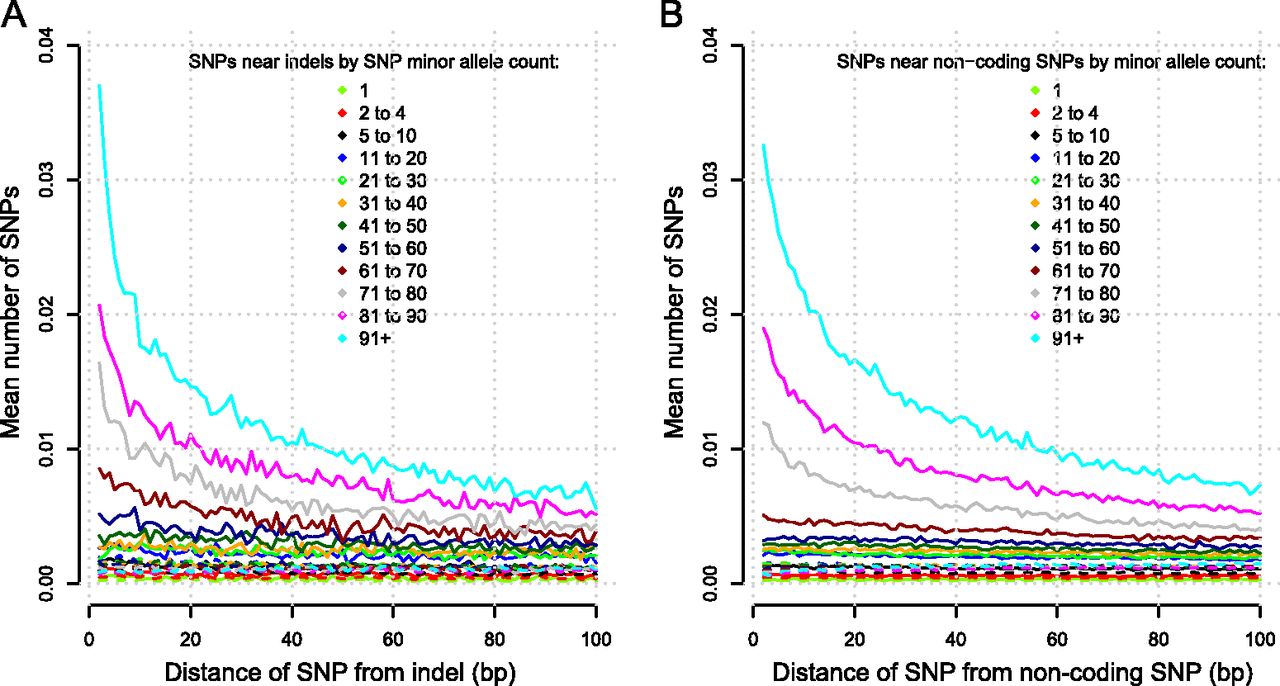
Figure 3.
Nonrandom distribution of variants. The average number of SNPs (y-axis) for each distance in bp (x-axis) from either side of a variant of high frequency (MAF 40%–50%). Solid lines represent the number of SNPs of a given range of allele counts in lines that have the variant in question, whereas dashed lines show the number of SNPs in lines that do not have the variant. (A) Indels. (B) Noncoding SNPs.