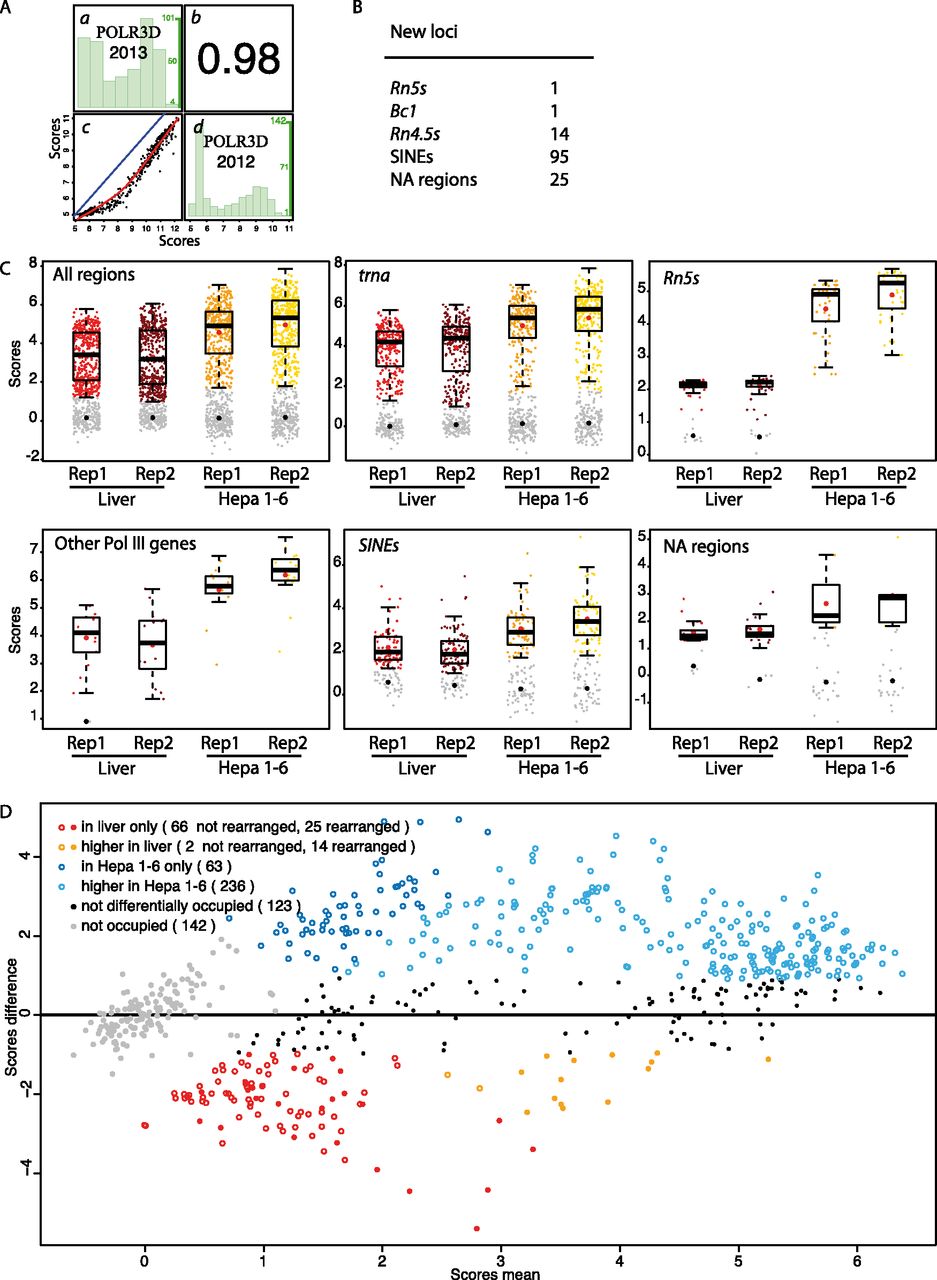
Pol III–occupied loci in mouse liver and Hepa 1-6 cells. (A) Spearman's rank correlation of scores obtained by Canella et al. (2012) and in this work. The loci considered include all tRNAs and SINEs. (c) x-axis, POLR3D scores in this work; y-axis, POLR3D scores by Canella et al. (2012); in blue, the x = y line; in red, the regression line. (b) Correlation coefficient. (a) Distribution histogram representing, for each POLR3D 2013 score interval of 1 (see x-axis at the bottom of c), the number of genes in that interval (y-axis at the right of the panel: The numbers in green correspond to the lowest, middle, and highest number of genes). (d) As in a but for each POLR3D 2012 score interval of 0.5. (B) List of additional, Pol III–occupied loci identified in this work compared with that of Canella et al. (2012). (C) Box plots showing scores in replicate 1 (Rep1) and replicate 2 (Rep2) samples from liver or Hepa 1-6 cells, as indicated on the x-axis. The y-axis shows scores in log2. Genes with scores below the cutoff (see Methods) are represented by gray dots. The median is indicated by the black horizontal bar, the mean of genes above the cutoff by the red dot, and the mean of genes below the cutoff by the black dot. The genes shown on the various panels correspond to the lists on the various pages of Supplemental Table S3. (D) MvA plot illustrating differential Pol III occupation in liver versus Hepa 1-6 cells. The x-axis shows score means [(POLR3D mean score in liver + POLR3D mean score in Hepa 1-6 cells)/2], and the y-axis score differences (POLR3D mean score in Hepa 1-6 cells − POLR3D mean score in liver). All scores are in log2 (see Supplemental Tables S3, S4).