Figure 3.
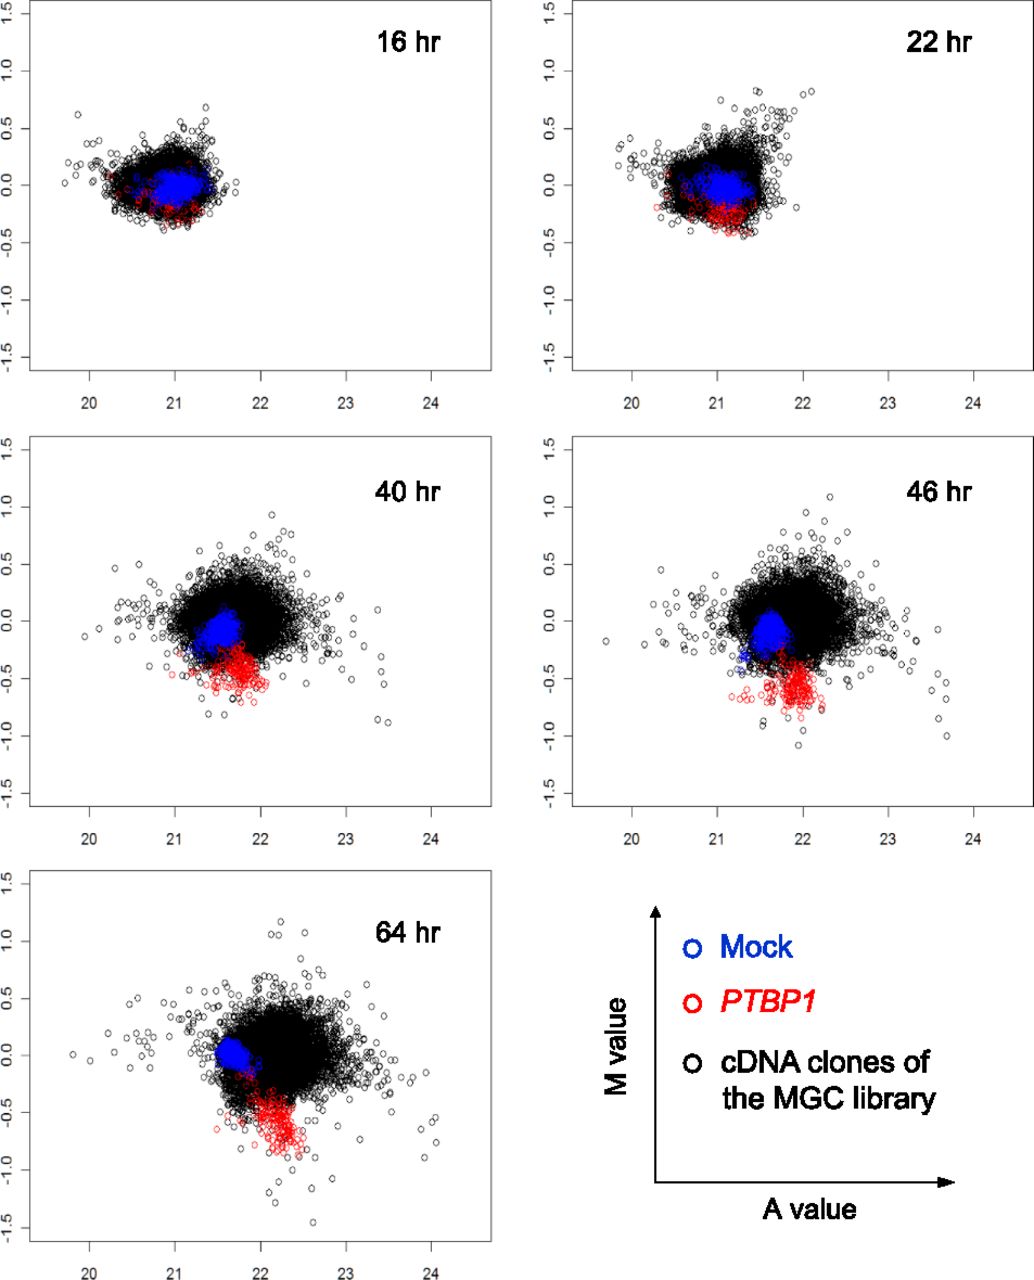
Scatter plots of the M value versus the A value for the pflareG-exon 18 reporter at 16, 22, 40, 46, and 64 h after transfection of the MGC cDNA library (black), the spiked-in PTBP1 cDNA (red), or mock transfection (blue).
Scatter plots of the M value versus the A value for the pflareG-exon 18 reporter at 16, 22, 40, 46, and 64 h after transfection of the MGC cDNA library (black), the spiked-in PTBP1 cDNA (red), or mock transfection (blue).