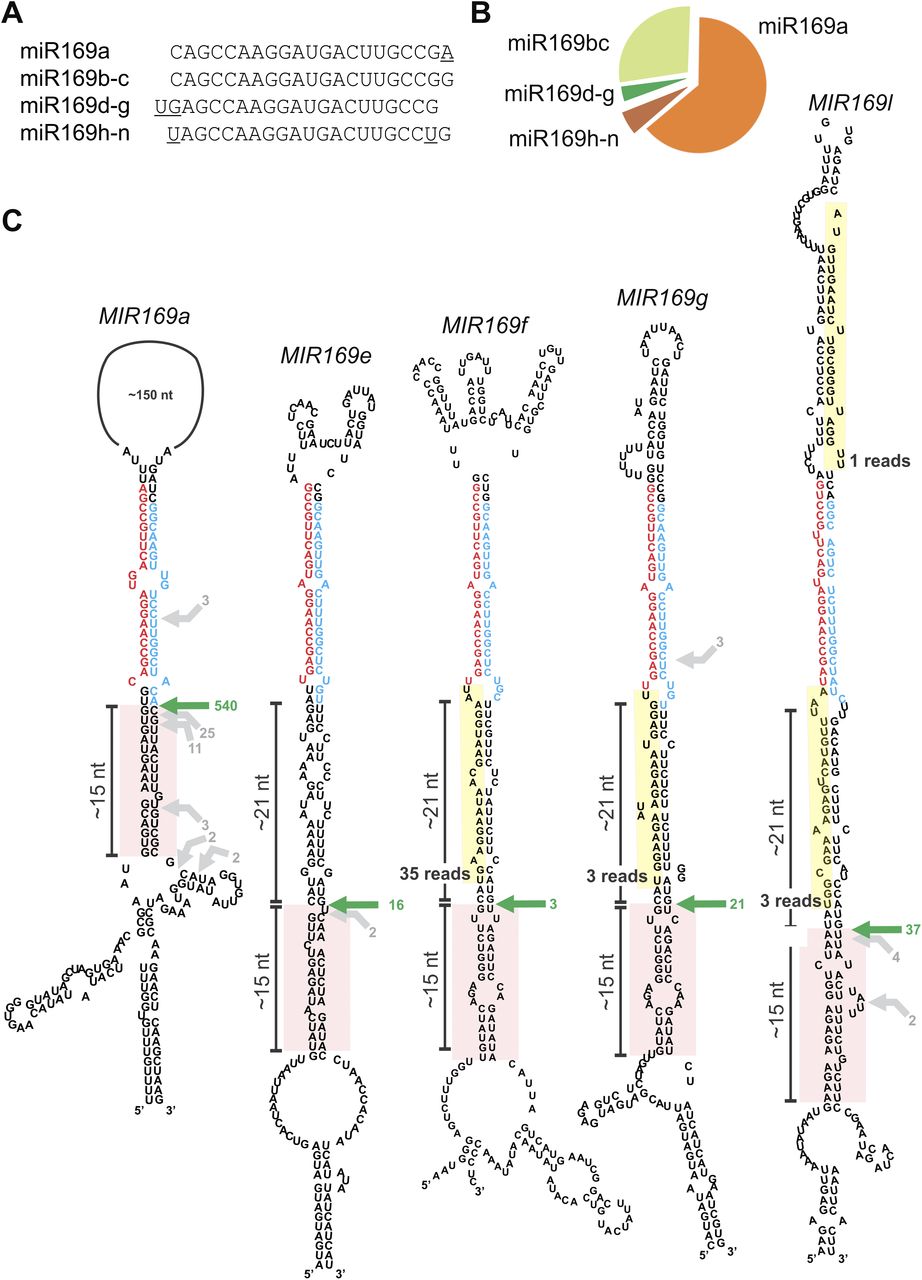
Figure 3.
Single and sequential processing of MIR169 family members. (A) Sequences of miR169 small RNAs. (B) Relative abundance of the small RNAs determined by deep-sequencing small RNAs from wild-type plants. (C) Scheme showing precursors of selected MIR169 family members. The arrows indicate the positions and number of reads corresponding to the miRNA precursor cleavage sites identified. The most abundant cut is indicated by a green arrow. Gray arrows show other less abundant cleavage sites. A lower stem structured region of ∼15 nt below the first cut is highlighted with a pink box. Additional small RNAs detected by deep-sequencing small RNAs are indicated in yellow. The miRNAs are indicated in red and the miRNAs* in blue.