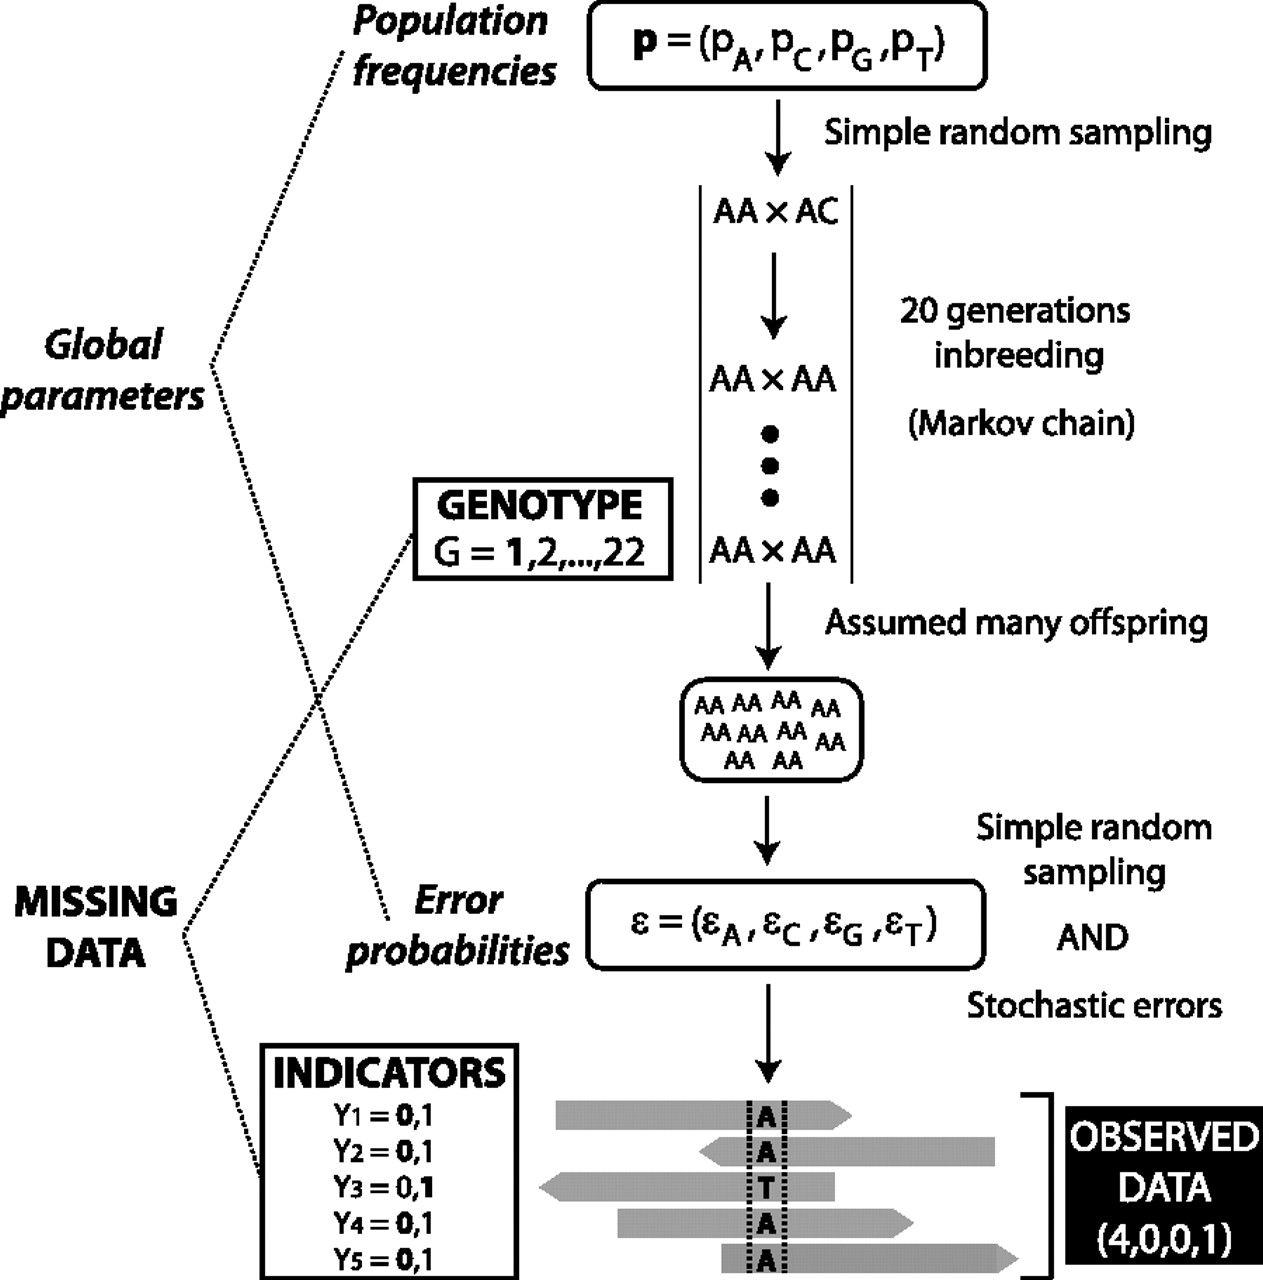
Detailed model and estimation framework for one line at one site. Frequencies of A, C, G, and T in the population govern the distribution of parental genotypes in generation 0 (AA × AC in the figure). The distribution of parental genotypes at generation 20, conditional on the genotypes at generation 0, is specified by the Markov chain described in Methods. It is assumed that this cross produces many offspring in the absence of segregation distortion so that the nucleotide frequencies among the offspring match those of the parents. The sequencing reads, which are the observed data, are composed of a random sample of these nucleotides (with replacement) along with errors whose frequencies are given by ɛ. The unobserved, or missing, data are composed both of the parental genotypes at generation 20 (here  for AA × AA) (cf. Table 1) and indicators (
 ) that record the error status of each read. For example,
  in the figure because the T is an error, which is clear when the “genotype”
  is known, provided mutation is precluded. While each line has its own observed and missing data, the global parameters
  and ɛ are common to all lines.