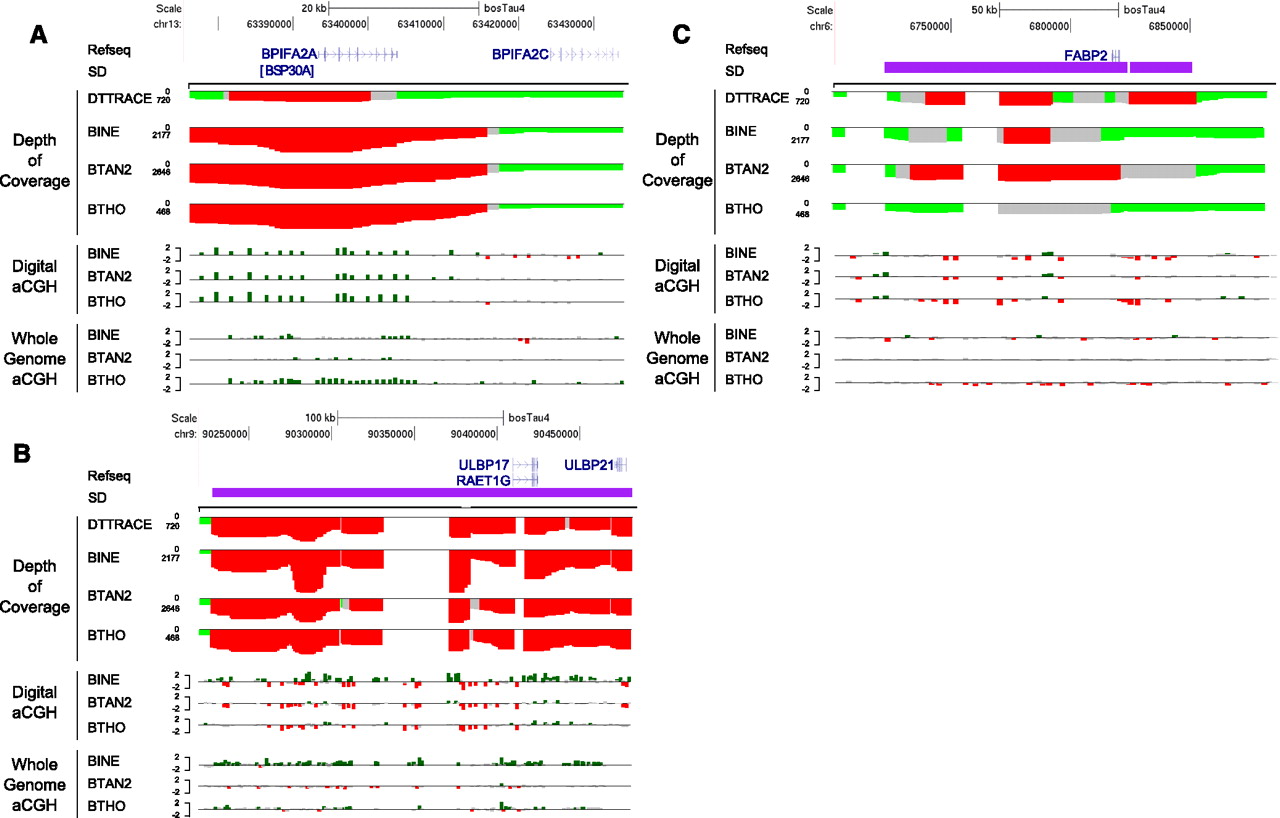
Computational predictions and aCGH validations of segmental duplication copy number differences for six cattle genomes. Depth-of-coverage tracks for DTTRACE, BINE, BTAN2, and BTHO are below a UCSC track for each investigated gene region. Regions colored in red on the plot indicate excessive read depth (> mean + 4 × STDEV), whereas gray regions indicate intermediate read depth (> mean + 3 × STDEV). Normal read depth values are colored green (mean ± 2 × STDEV). Digital aCGH tracks show the log2 ratio of the copy number of each listed animal compared to DTTRACE, with high values listed in green (>0.5); low values: red (<−0.5); and nominal values: gray (0.5 > x > −0.5). Whole-genome CGH array experiments, using Dominette as a reference sample in all cases, are listed below the digital aCGH experiments. Color schemes for the aCGH plots are the same as for the digital aCGH. Previously detected segmental duplications (SDs) are shown below the UCSC plot, if present in the region. (A) CNVs intersecting the BPIFA2A (BSP30A) locus (chr13:63364661-63487495). A duplication of this region was predicted for all animals and was confirmed by whole-genome aCGH. (B) In the ULBP17 locus (chr9:90209622-90499803), BINE was predicted to have a higher copy number than DTTRACE across the region from both read depth and aCGH experiments. (C) The promoter region of FABP2 (chr6:6701747-6888288) was a predicted duplication in Dominette (Hereford; beef breed), BTAN2 (Angus; beef), and BINE (Nelore; dual-purpose) but not in BTHO (Holstein; milk).