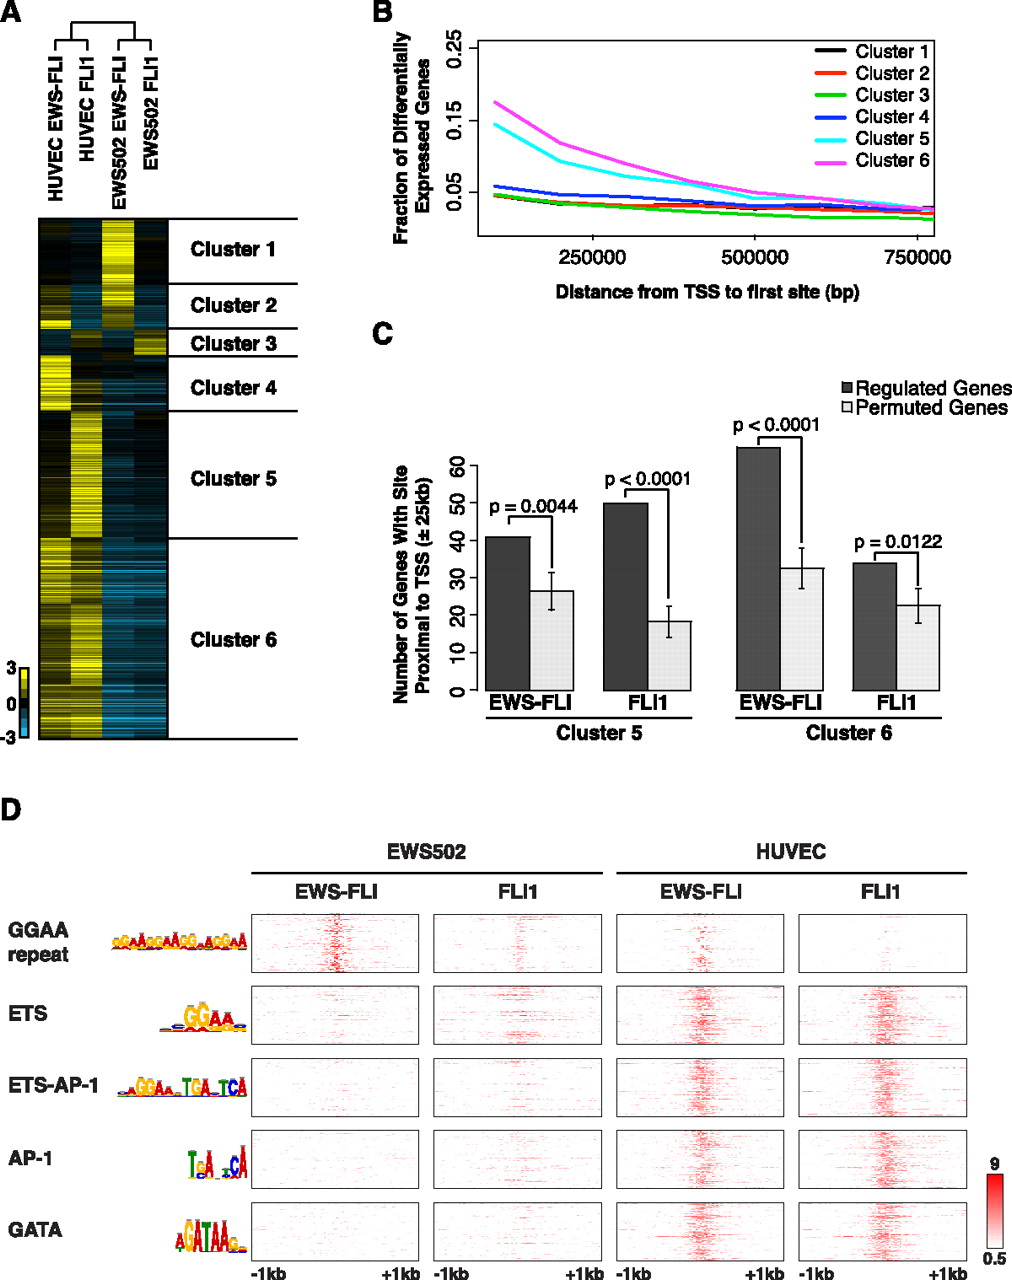
Hierarchical clustering identifies cell and transcription factor–specific variation in genomic targeting. (A) Hierarchical clustering of 6525 binding sites that exhibited the widest variation in signal across transcription factors or cell types. Each row was median-centered and colored based on the average read count across the region. (B) Distance (bp) from the transcriptional start site of the union set of differentially expressed genes to the closet site from clusters 1–6. (C) Number of EWS–FLI or FLI1 differentially expressed genes in HUVEC containing a cluster 5 (left) or cluster 6 (right) site within 25 kb of its TSS, compared with 10,000 permutations of all RefSeq genes. (D) Normalized log2 ChIP-seq signal around the midpoint of identified de novo transcription factor motifs derived from the sequences underlying sites in each cluster. Clusters 1 and 2 were merged for the composite GGAA microsatellite motif (1362 rows). Clusters 3–6 were merged for ETS (682 rows), ETS–AP1 (2780 rows), AP1 (1903 rows), and GATA (812 rows). Color was assigned on a log2 scale from 0.5 to 9.