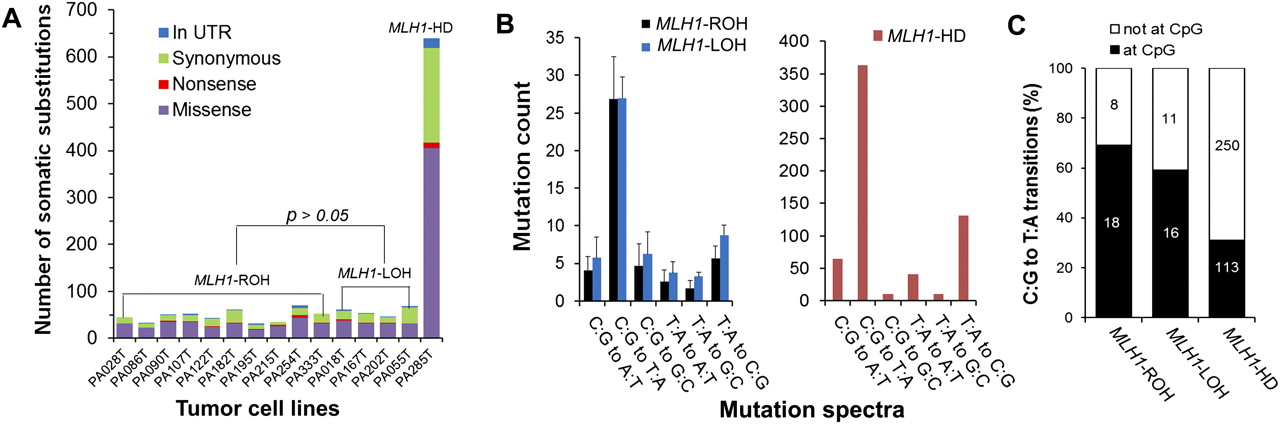
Figure 3.
Characterization of the somatic base substitutions. (A) The number of somatic base substitutions. The MLH1-HD cell line showed a dramatically elevated mutation rate of somatic substitutions. (B) The pattern of mutation spectra. (C) The distribution of the C:G to T:A transitions at and not at the CpG dinucleotides. For B, the data are shown as mean ± SD. As for C, the mean values are marked on corresponding columns.