Figure 3.
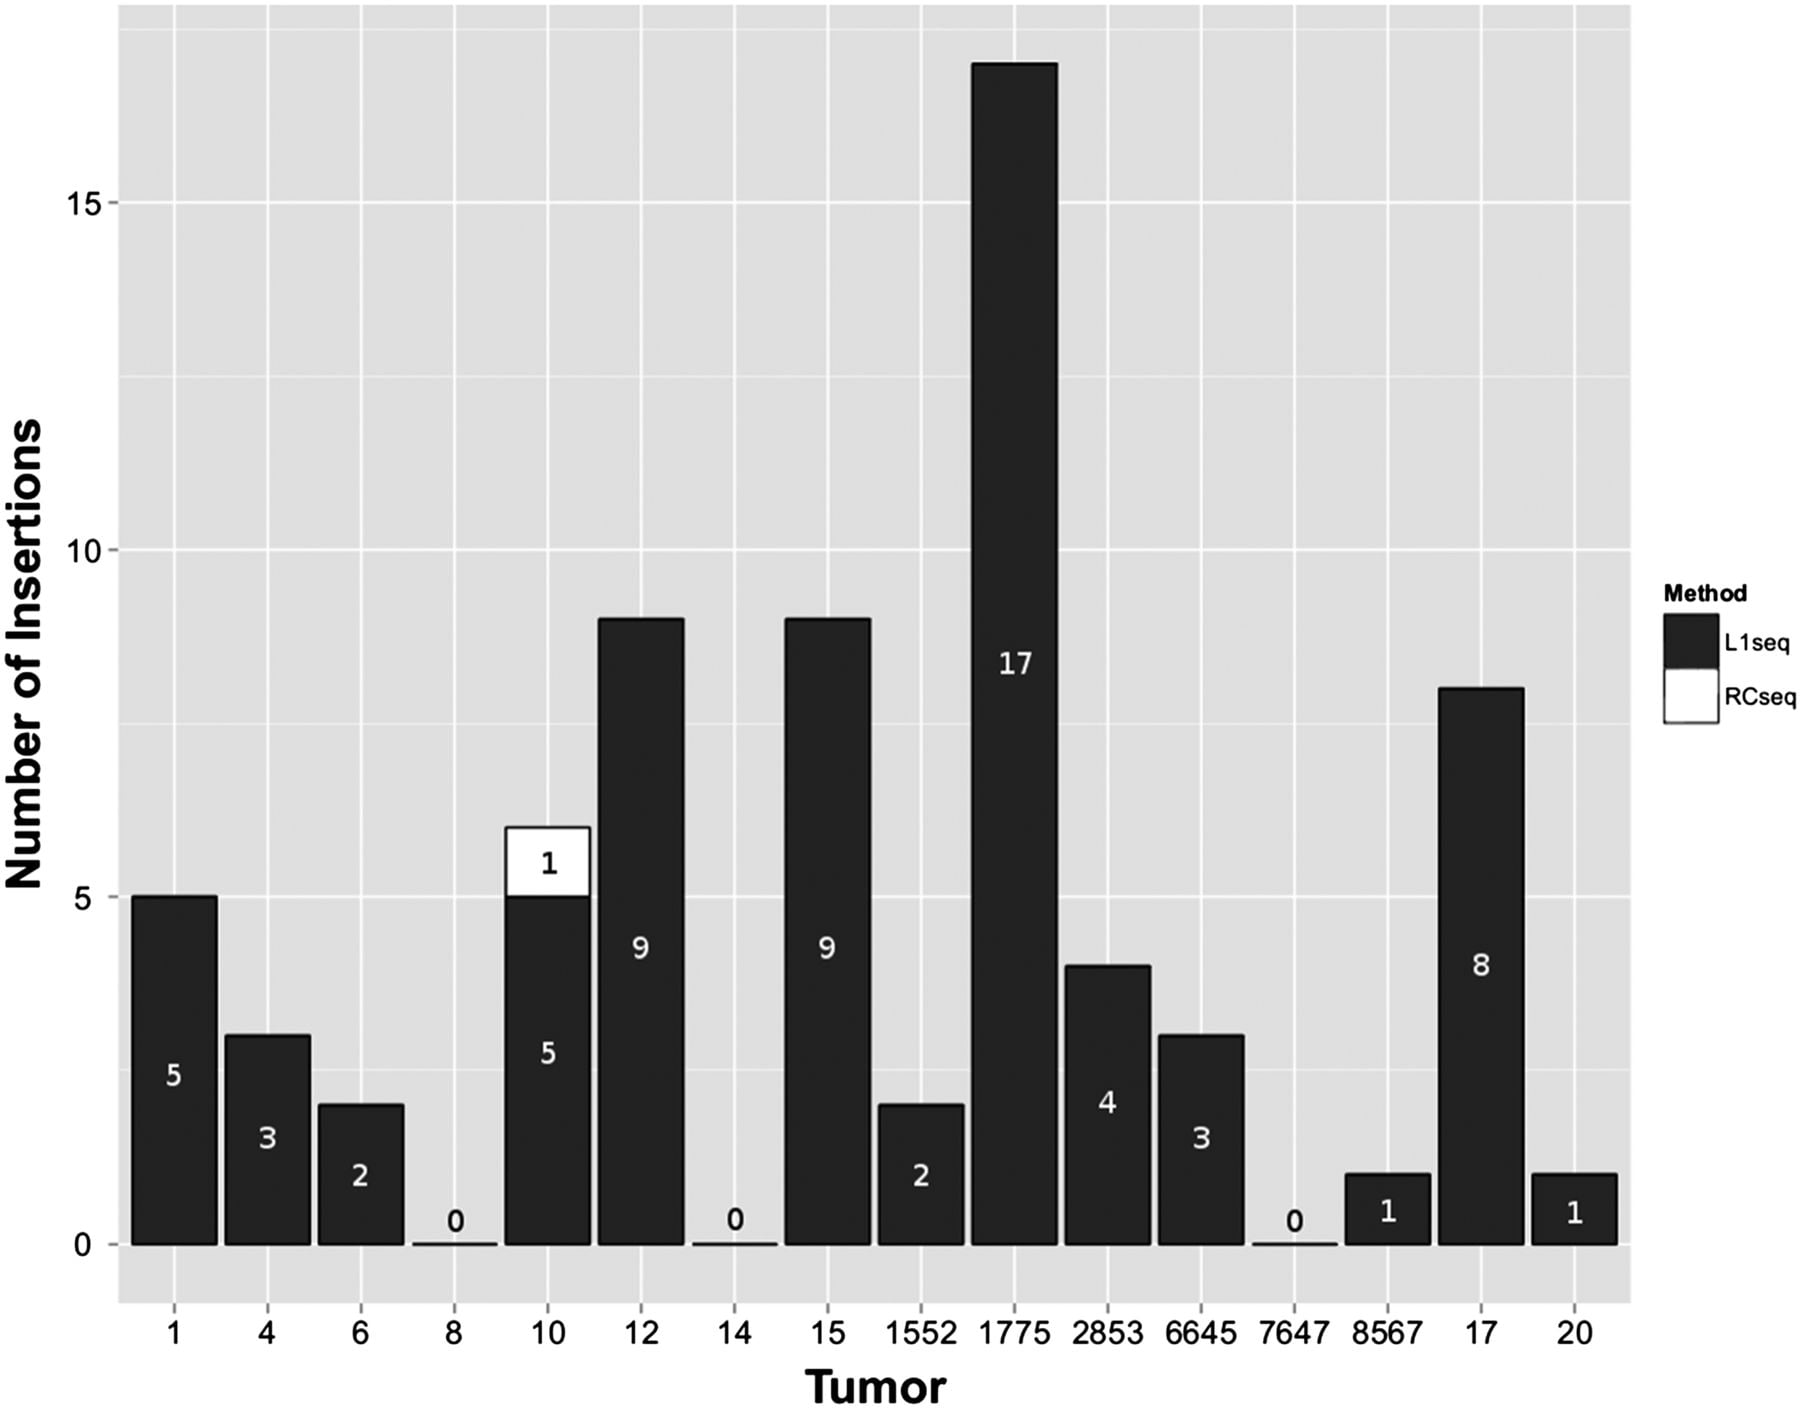
Distribution of somatic L1 insertions in tumors. Insertions in black were detected by L1-seq, while the insertion in tumor 10 in white was detected by RC-seq only.
Distribution of somatic L1 insertions in tumors. Insertions in black were detected by L1-seq, while the insertion in tumor 10 in white was detected by RC-seq only.