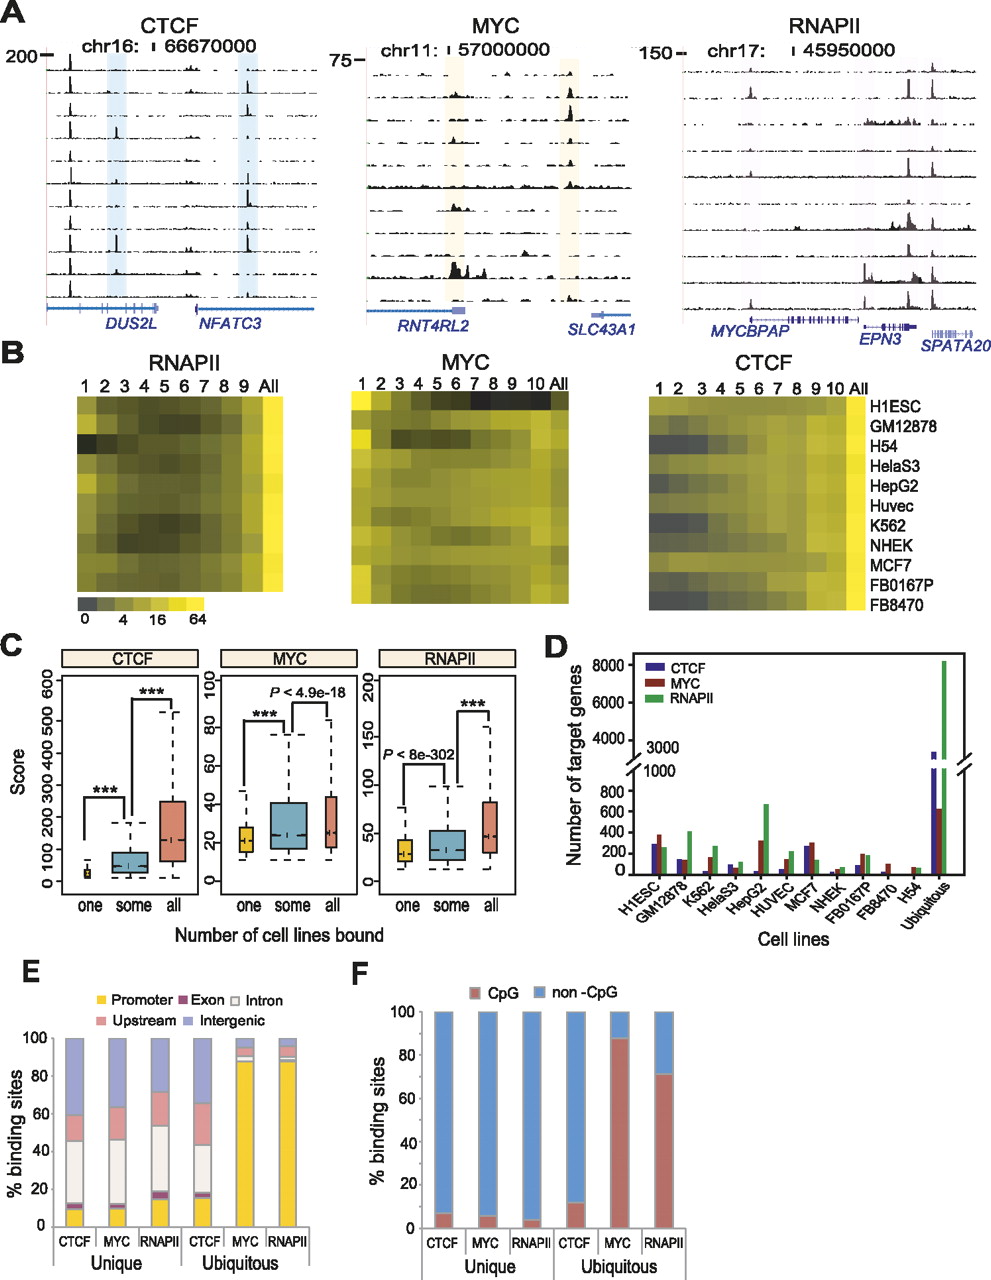
CTCF, MYC, and RNAPII have many cell-type specific regulatory elements. (A) Track images show examples of cell-type specific sites of each factor in different cell types. (B) Heat maps show the relative distribution of cell-type specific and ubiquitous binding sites of each factor in 10–11 different cell types. The horizontal axis represents the number of cell types sharing a binding site; thus, “1” represents “unique” sites found in only one cell type, “All” indicates “ubiquitous” sites found in all cell types, and other numbers show intermediate representation. Here we denote all sites with the exception of ubiquitous sites as “cell-type specific” sites. The color in the heatmap indicates the proportion of sites in each category, in each cell type. (C) Boxplots show the ChIP-seq score distribution of unique (“one”) and ubiquitous (“some” and “all”) sites across all cell types. Unique sites have significantly lower ChIP-seq scores than the other sites. P-values were calculated by Wilcoxon rank sum test. Asterisks indicate a calculated P-value of zero. (D) The number of unique and ubiquitous target genes of CTCF, MYC, and RNAPII in diverse cells. The downstream genes of TF-bound promoters (within ±2 kb from TSS) were considered as target genes. (E) The distribution of unique and ubiquitous binding sites of CTCF, MYC, and RNAPII across all cell types, in five different genomic regions. The x-axis represents each factor in either unique or ubiquitous sites. The y-axis shows % binding sites in the genomic regions. (F) Percent CpG and non-CpG sites in unique and ubiquitous binding sites across all cell types. The x-axis represents each factor in either unique or ubiquitous sites. The y-axis indicates percent binding sites of these three factors in CpG or non-CpG sites.