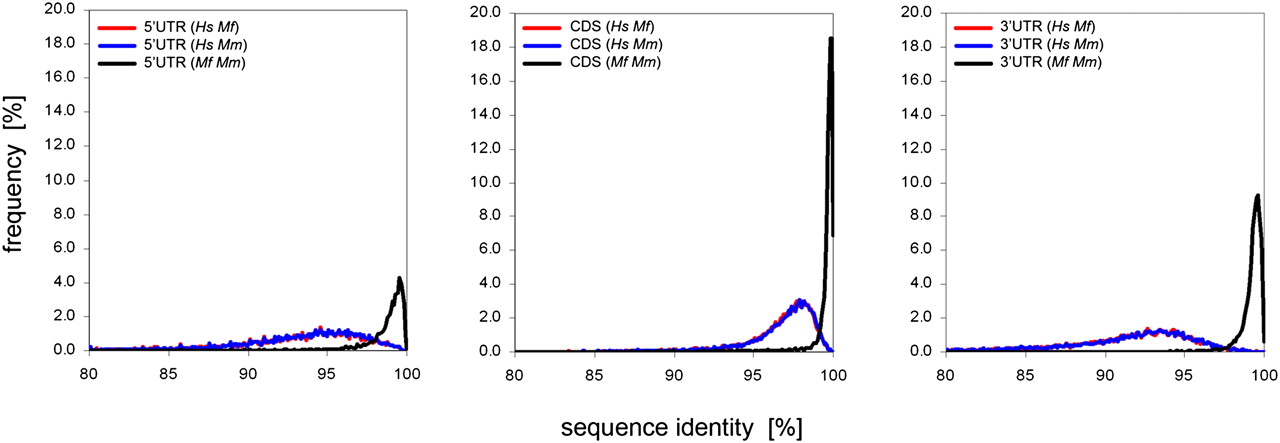
Figure 3.
Sequence identities between orthologous transcripts of M. fascicularis, M. mulatta, and H. sapiens. The 5′ UTR (left), CDS (middle), and 3′ UTR (right) of 10,919 orthologous mRNAs were considered separately for the calculation of pairwise sequence identities. The relative number of 1:1 orthologous sequences was plotted against the sequence identities. Frequency plots of sequence identities <100% between M. fascicularis and M. mulatta (Mf Mm), H. sapiens and M. fascicularis (Hs Mf), and H. sapiens and M. mulatta (Hs Mm) transcripts are displayed. Note that the peak sequence identities for the UTRs are significantly lower between humans and macaques than for the coding regions.