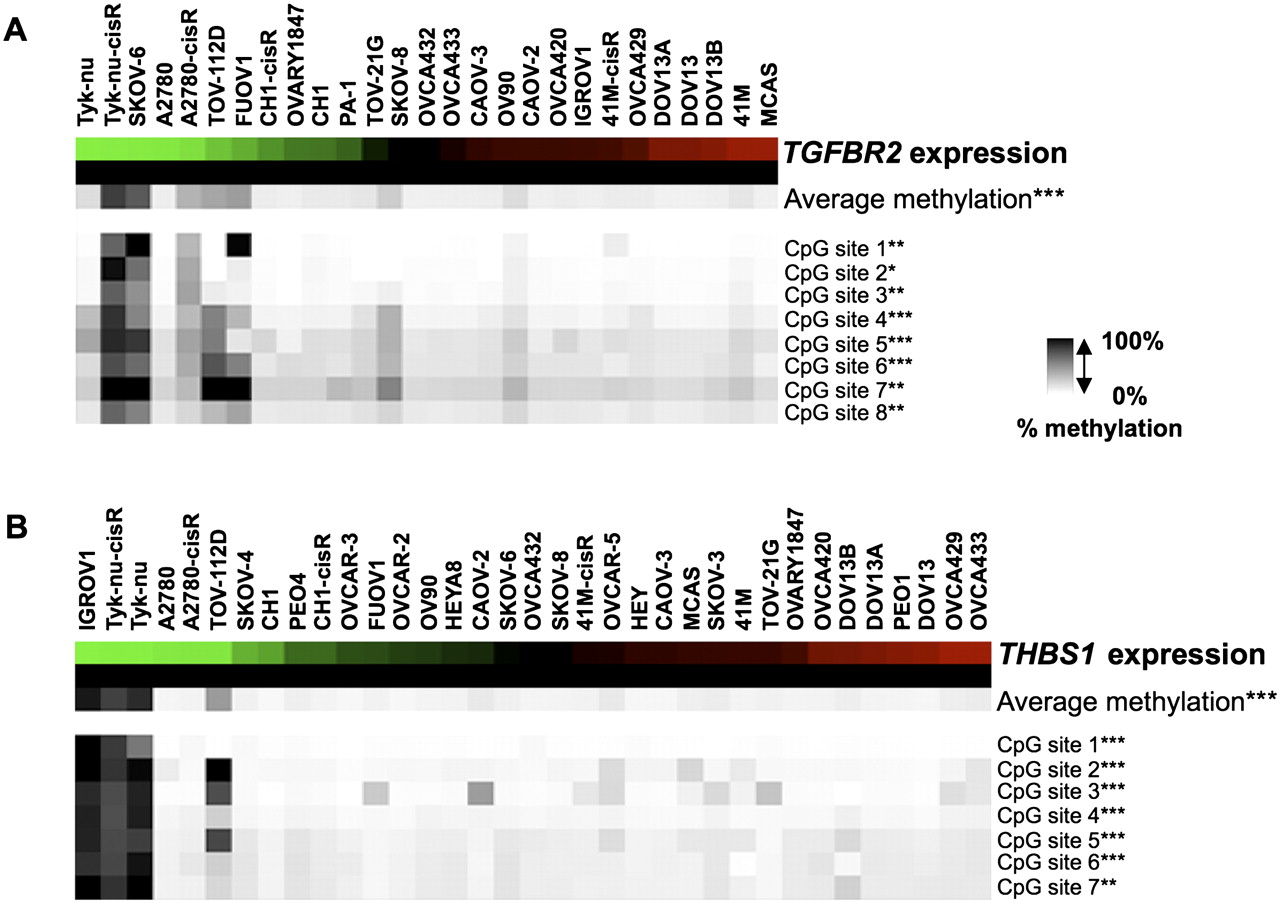
Figure 3.
Methylation of predicted genes is associated with repression of transcription. Quantitative pyrosequencing was used to measure methylation present at the promoters of TGFBR2 (8 CpG sites; A) and THBS1 (7 CpG sites; B). Expression is indicated by the green-red (low-high) color bars at the top of each panel. Significant correlations between methylation and expression are indicated by the asterisks: *P < 0.05; **P < 0.01; ***P < 0.001.