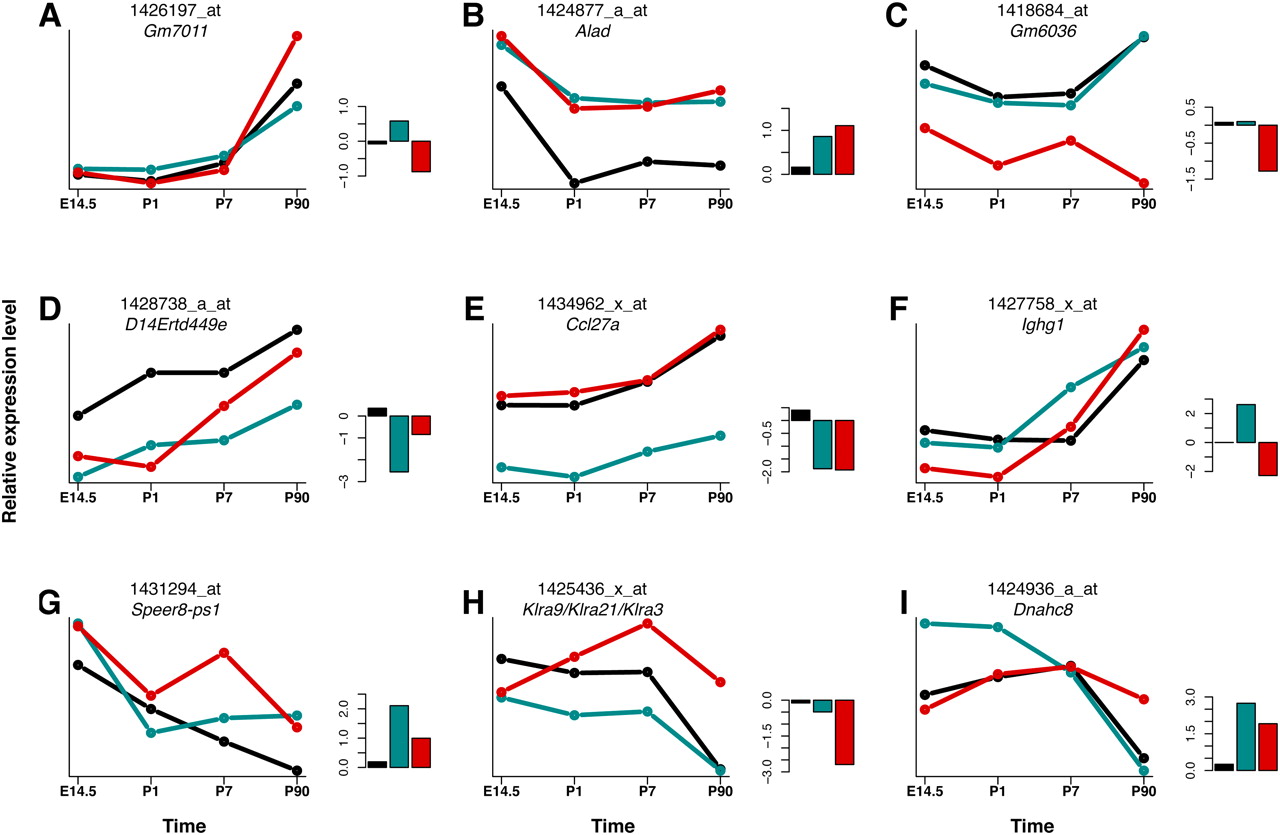
Examples of time course expression profiles in liver. Relative expression levels of CNV transcripts during development in the three inbred strains: C57BL/6J (black line), DBA/2J (red), and 129S2 (teal). Examples of CNV transcripts under regulatory feedback loops that buffer gene-dosage alterations (transcript monitored by probeset 1426197_at; A), showing a positive correlation between relative copy number and expression levels (1424877_a_at, 1418684_at, and 1428738_a_at; B–D, respectively), showing a positive correlation between relative copy number and expression level in one strain and buffering of gene dosage in another (1434962_x_at; E), or with modified time courses of expression (1427758_x_at, 1431294_at, 1425436_x_at, and 1424936_a_at; F–I, respectively). Bar graphs on the right show the log2 ratios for the CNV encompassing the transcript considered in C57BL/6J (black), DBA/2J (red), and 129S2 strains (teal) relative to the C57BL/6J reference as determined by array CGH in Henrichsen et al. (2009b). We note that the noise-robust soft clustering algorithm Mfuzz (Futschik and Carlisle 2005) included in the same cluster the time courses registered for the CNV transcript 1426197_at in A) in the three different mouse inbred strains, while all other CNV transcripts shown here were incorporated in multiple clusters, thus illustrating the propensity of CNV genes to change their timing of expression between strains (see text for details).