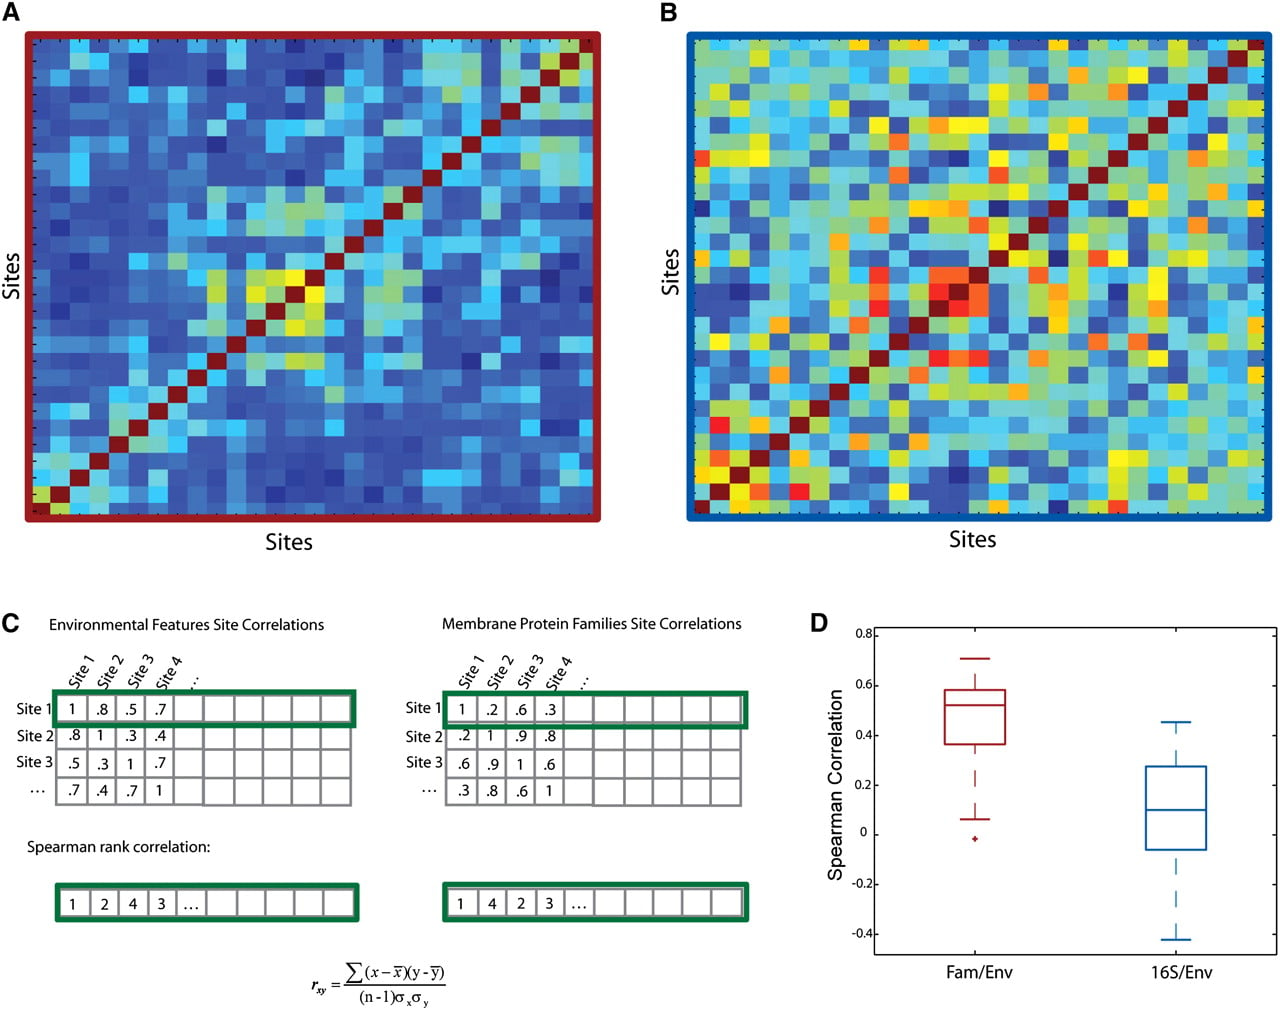
Site-site correlations, where each site is defined by 151 membrane protein families (Site-Site-Fam, [SS-FAM]) (A) and 16S genes at the 20% divergence level (SS-16S) (B) (sites ordered as in Fig. 2A). (C) Method description: For each row of SS-FAM, we sort the correlation coefficients and convert them to rank-order. We then repeat this procedure for SS-16S and SS-Env (Fig. 2A); then, we compare the ranks of SS-FAM and SS-Env, as well as SS-16S and SS-Env. If the rank vectors are similar to one another, this implies that differences in one set of features are reflected in differences in a second set of features. For the FAM/Env, this is, indeed, the case; however, the low rank correlation between 16S/Env implies that 16S is not reflective of changes in environment as seen by the boxplot in D.