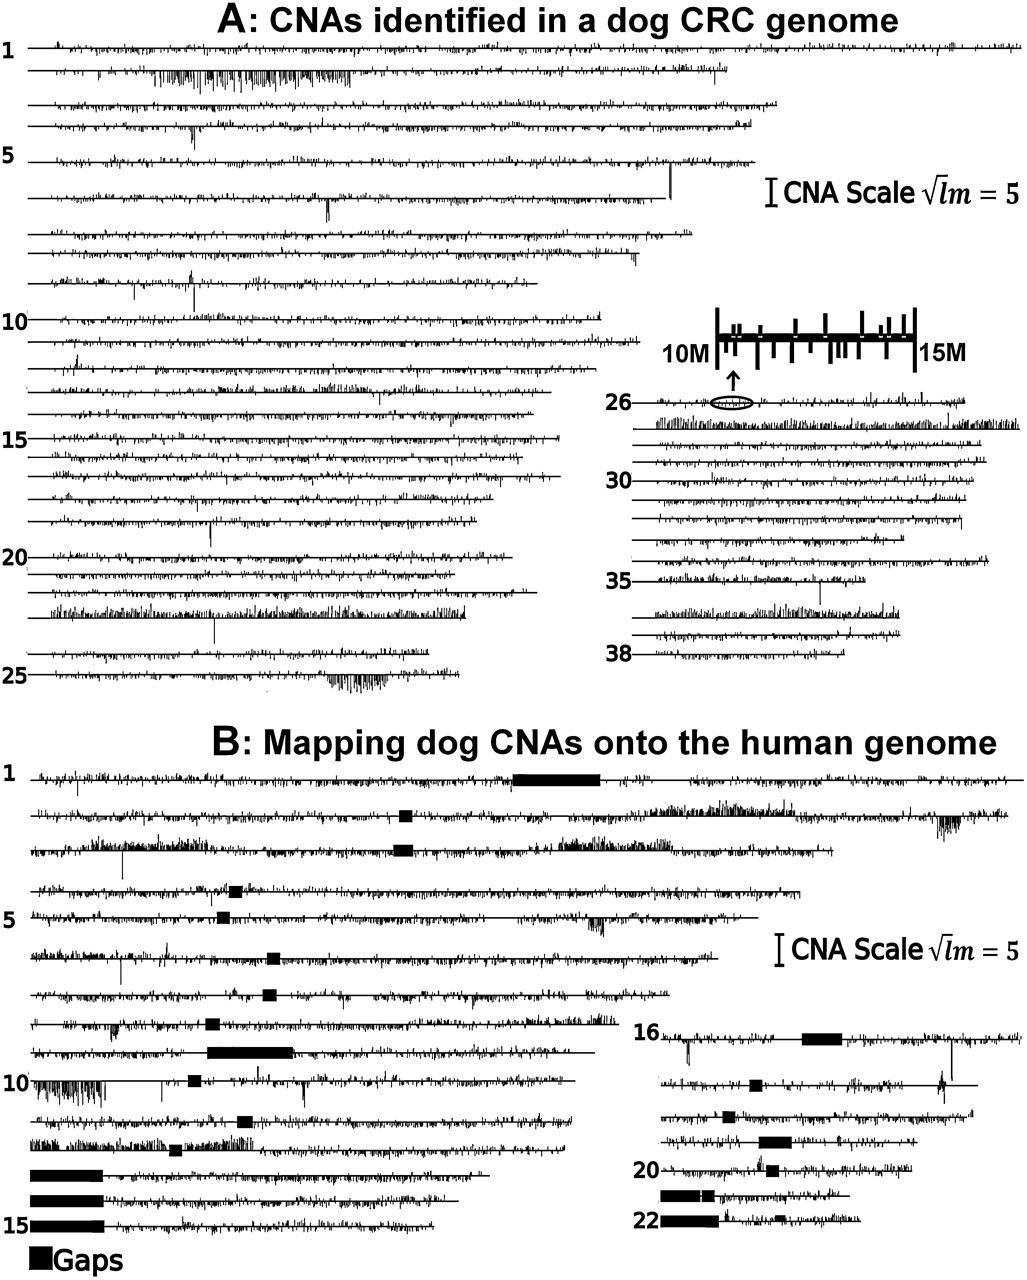
(A) CNAs identified in the genome of a dog adenocarcinoma (T11). The identified CNAs (3396 gains and 5711 losses) amount to 551 Mb (22% of the dog genome) (Table 1). Each line represents a dog chromosome with its chromosome number indicated on the right. Vertical lines shown above/below the chromosomes represent gains/losses, respectively, with their length calculated based on  , where l and m are the total probe number and the mean log2 ratio of the CNA. Except for CNAs that are larger than 1 Mb in size, the width of the vertical lines is not drawn to scale with the chromosome length. (B) Mapping dog CNAs onto the human genome. A total of 9107 CNAs and 541.6 Mb (98.2% of the total) of the same dog tumor shown above were mapped onto the human genome, amounting to 609 Mb on the human genome.