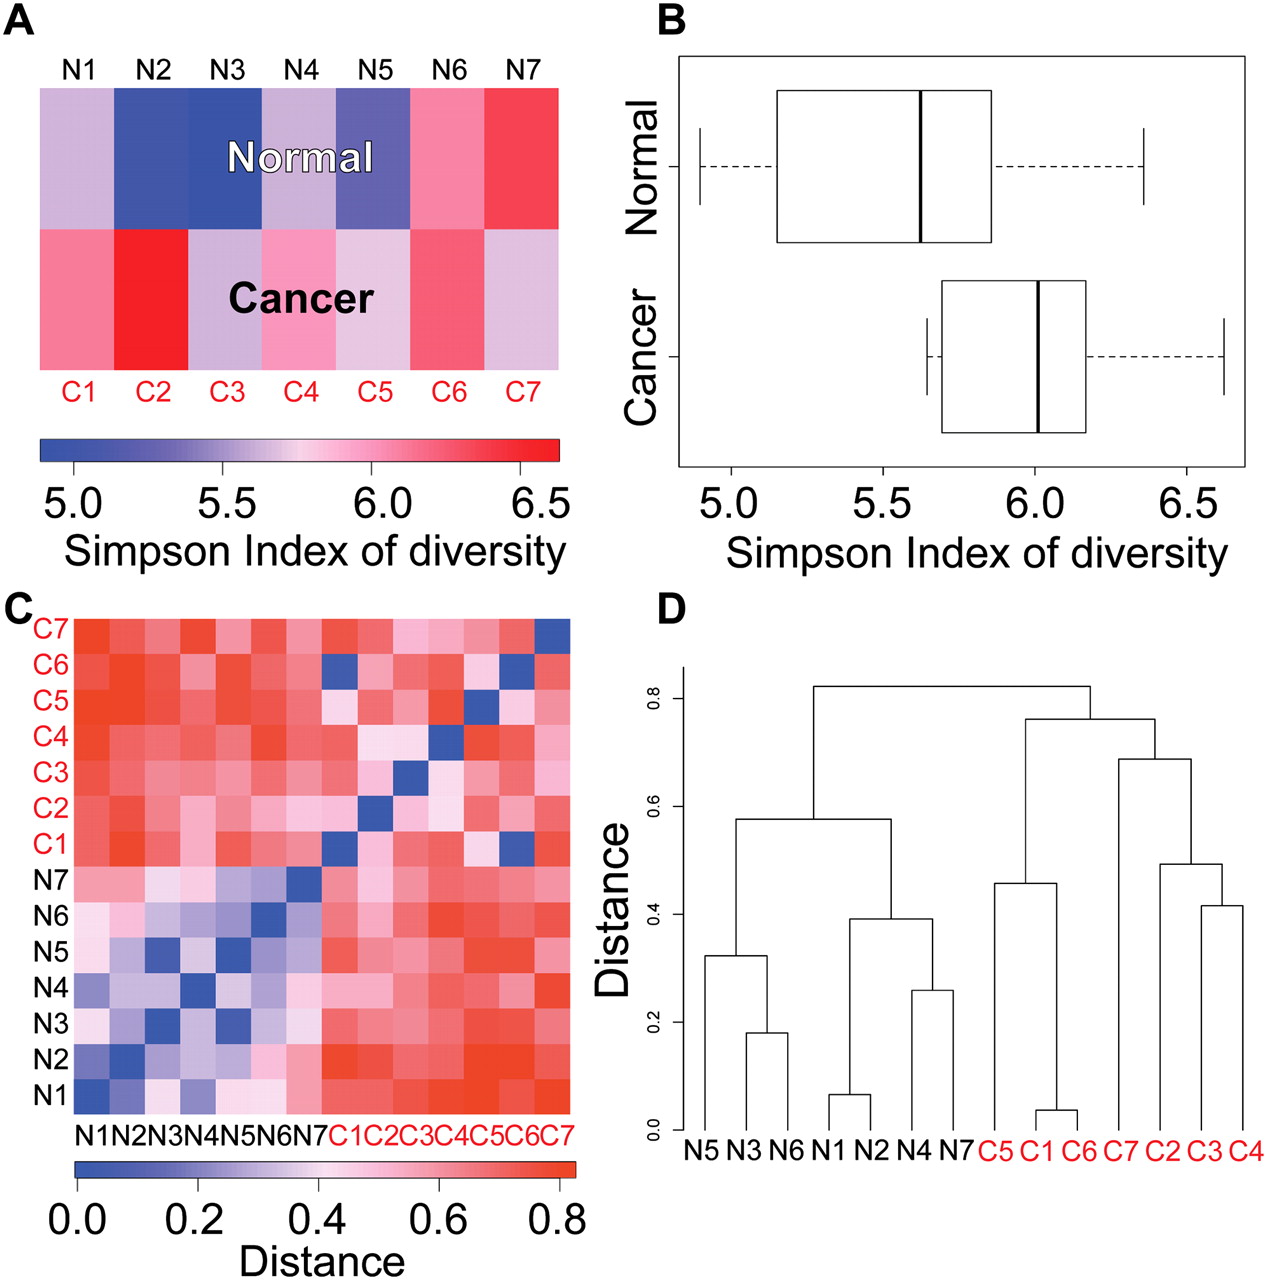
Figure 3.
Diversity of normal and cancer transcriptomes. (A) Simpson index of diversity to measure within-library gene expression diversity. Libraries in the cancer group show higher within-library diversity compared with the normal group. (B) Box plot depicting Simpson index of diversity of normal and cancer samples. P = 0.07284 (Wilcoxon rank-sum test). (C) Distance defined as “1 – Morisita-Horn similarity index” is used to measure gene expression diversity across libraries. Libraries in the normal group are more similar to one another, whereas cancer libraries are more diverse. (D) Hierarchical clustering using “distance” defined in C separates normal and cancer libraries.