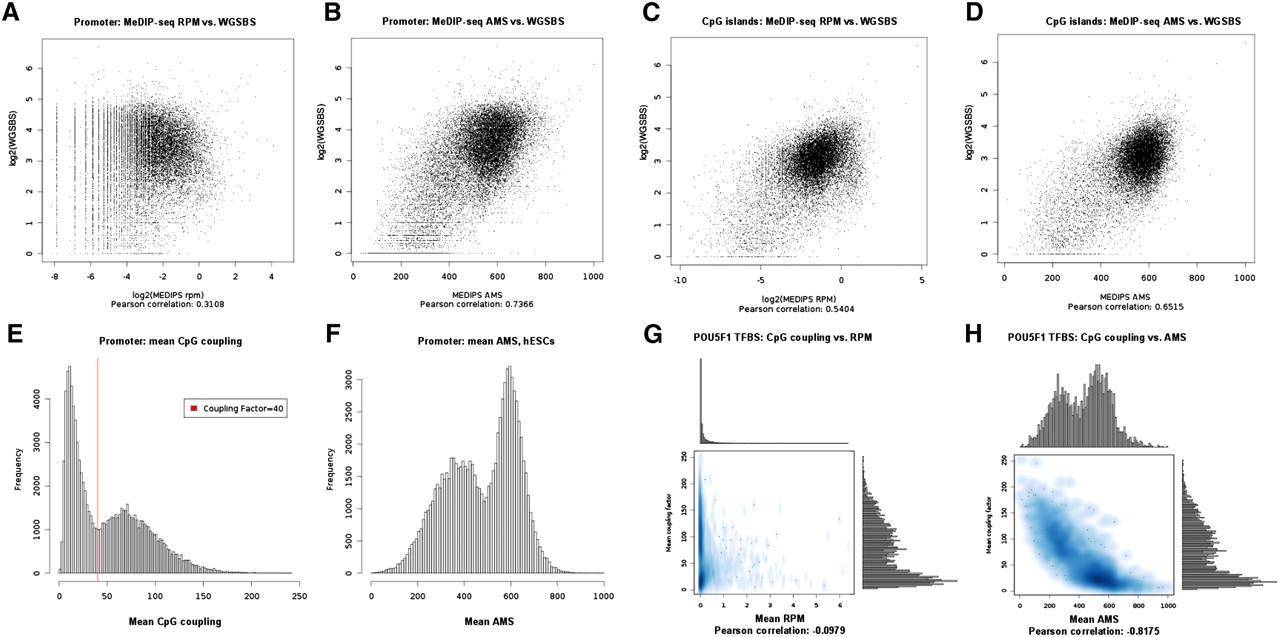
Promoter, CpG islands, and TFBS methylation and comparison to WGSBS. (A) We divided Ensembl (Birney et al. 2004) transcript promoters of chromosome 1 into 500-bp windows and show that mean WGSBS and mean reads per million (RPM) MeDIP-seq signals have a correlation of 0.31. (B) The WGSBS vs. MeDIP-seq correlation is increased to 0.74 after MEDIPS normalization of the MeDIP-seq signals into absolute methylation signals (AMS). For CpG islands, the correlation between mean rpm MeDIP-seq and mean WGSBS values is 0.54 (C) and is increased to 0.65 after MEDIPS normalization of the MeDIP-seq signals into ams (D). (E) DNA sequences underlying human promoters show a bimodal distribution of CpG densities (calculated as means of CpG coupling factors). By setting the coupling factor = 40, we define a threshold for discriminating between low (LCPs) and high (HCPs) CpG density promoters. (F) MEDIPS normalized ams reveal the bimodal promoter methylation distributions in hESCs. (G) POU5F1 binding sites (Lister et al. 2009) show low negative correlation (−0.10) between CpG density and un-normalized rpm values in hESCs. (H) MEDIPS normalized ams values reveal the negative correlation (−0.82) between CpG density and methylation present in POU5F1 binding sites. Interestingly, mean CpG coupling factors and mean normalized ams values indicate bimodal CpG density and methylation distributions of POU5F1 TFBSs.