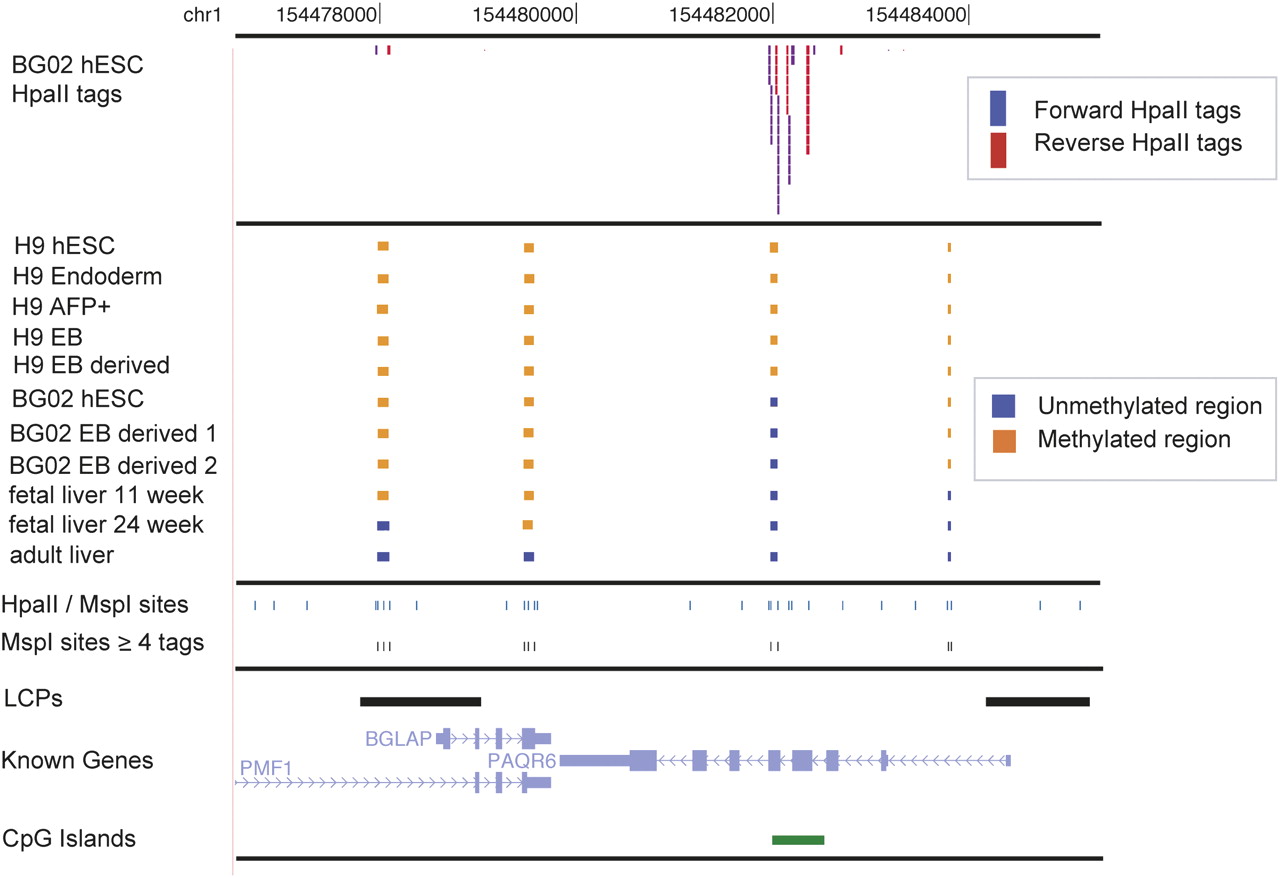
Browser shot of ∼9 kb of human chromosome 1 (hg18). Top data track shows sequence tags for the BG02 hESC HpaII library. Tags oriented in the forward direction are in blue; reverse direction, in red. The second grouping of data tracks illustrate the methylation calls for the Methyl-seq regions. Orange boxes represent methylated regions, and blue boxes are unmethylated regions. The third group of data tracks shows all of the predicted HpaII/MspI digestion sites (CCGG). The track labeled “MspI sites ≥4 tags” shows the Methyl-seq assayable sites, above the threshold of four. The last group of data tracks shows the regional annotations. LCPs are the low density CpG promoters, as predicted by Weber et al. (2007). The known genes and CpG islands were obtained from the UCSC Genome Browser. This window was chosen as an example of unmethylated and methylated regions, and shows regions with in vivo methylation changes: fetal liver 11 wk methylated vs. fetal liver 24 wk unmethylated (region 1); fetal liver methylated vs. adult liver unmethylated (region 2); a CPG island showing methylation differences between H9 samples and BG02 samples (region 3); and a region with differences between in vitro (methylated) and in vivo (unmethylated) samples (region 4).