Skip to main content
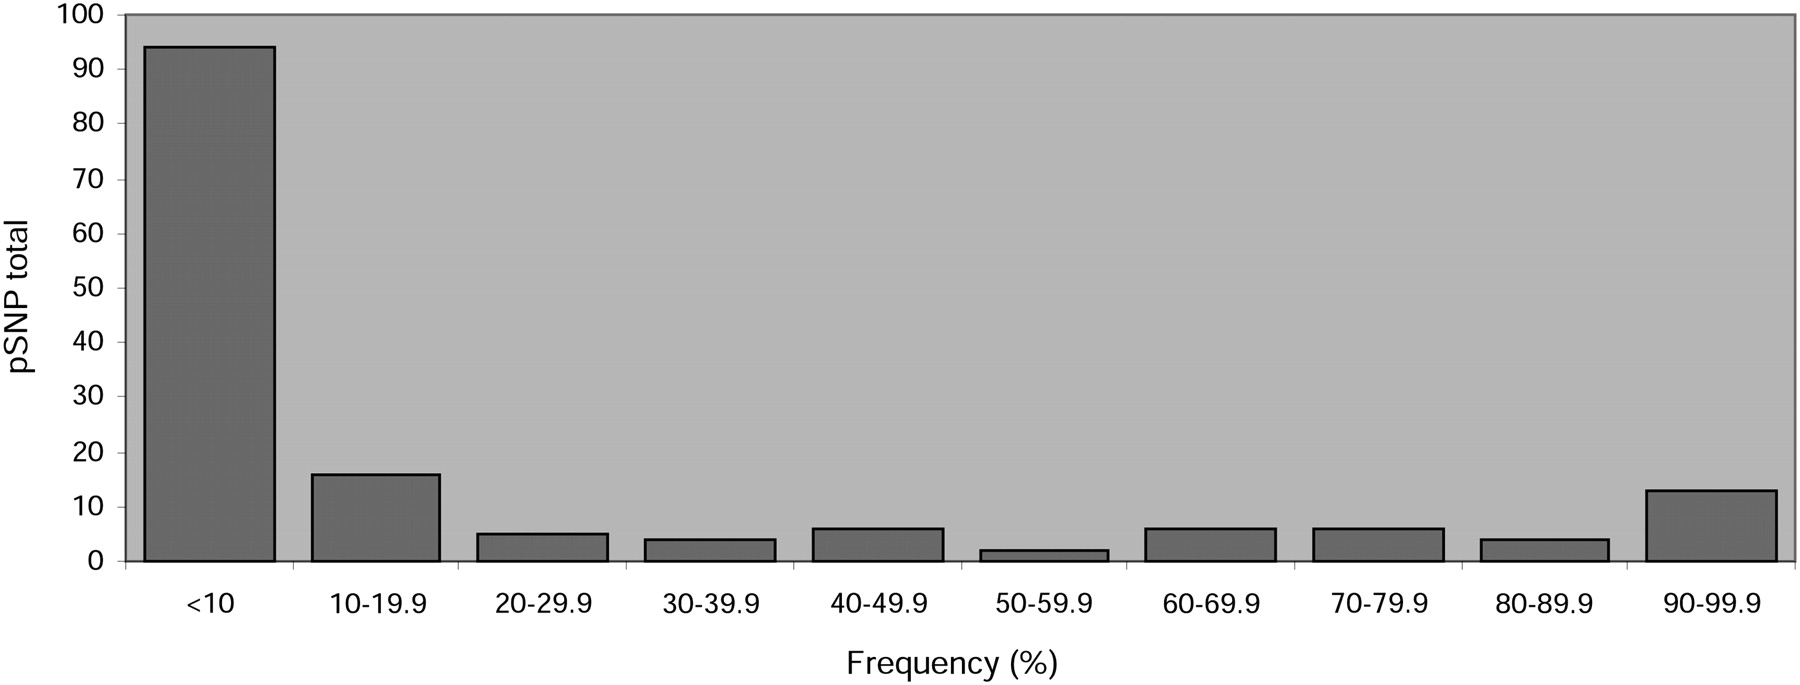
Figure 3.
Distribution plot of rDNA pSNP frequency (occupancy ratio) values grouped in bins of 10% increments.