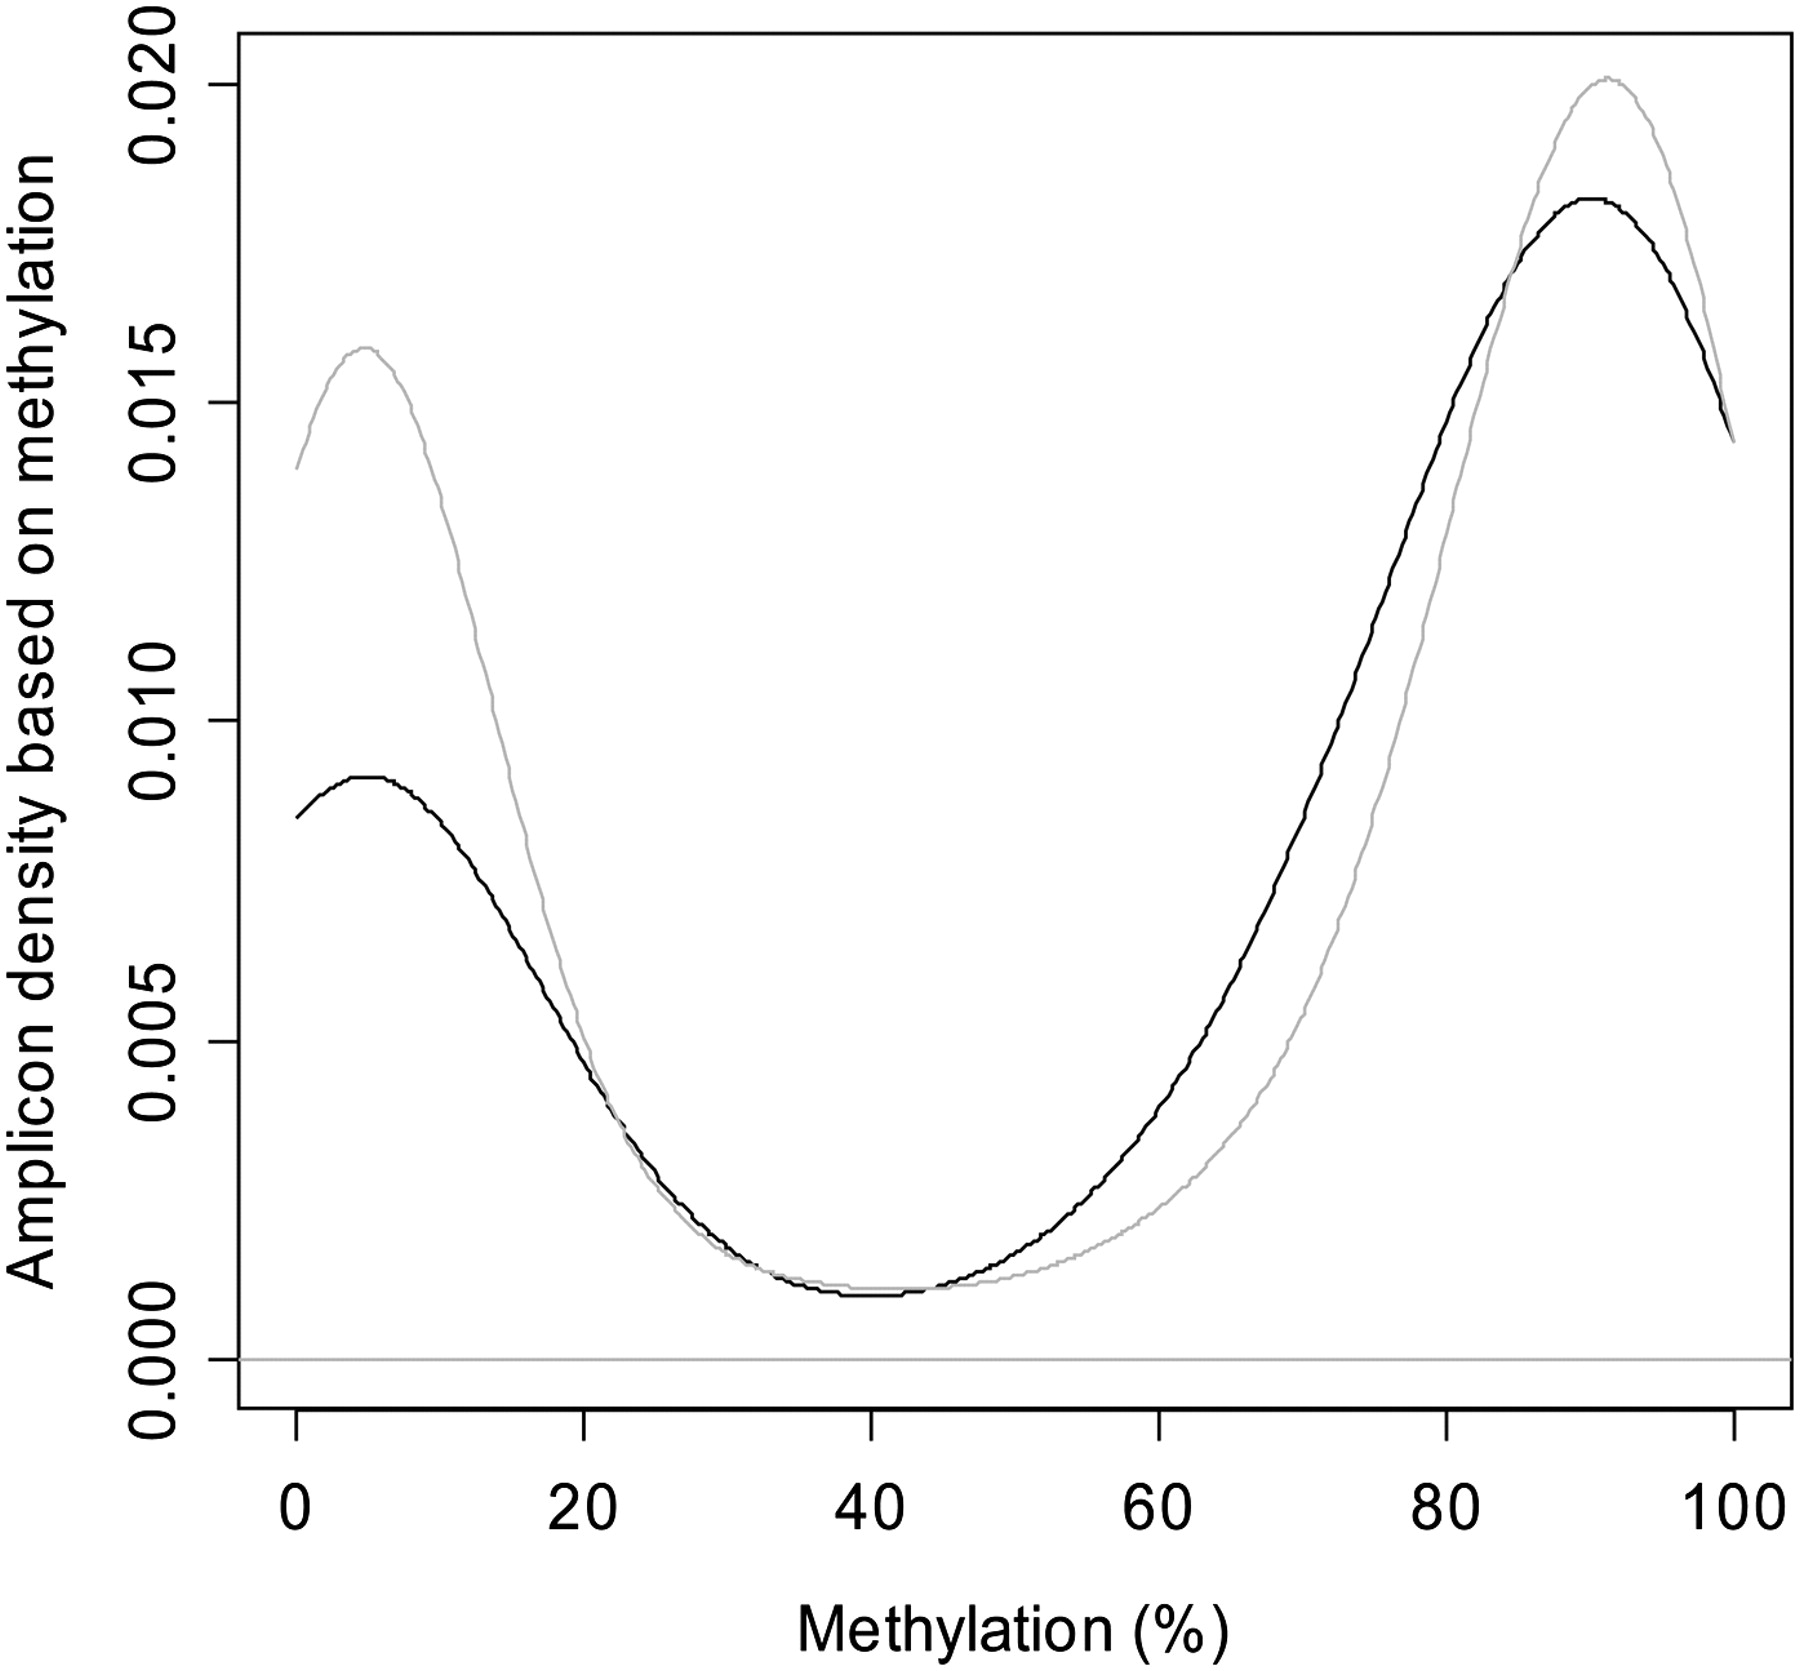
Figure 3.
Density map of the distribution of the average methylation of amplicons located inside recombination hot spots (black, n = 219) or outside of recombination hot spots (gray, n = 1745). Average methylation was significantly more in regions located within hot spots (0.632 vs. 0.557, P = 0.007, t-test).