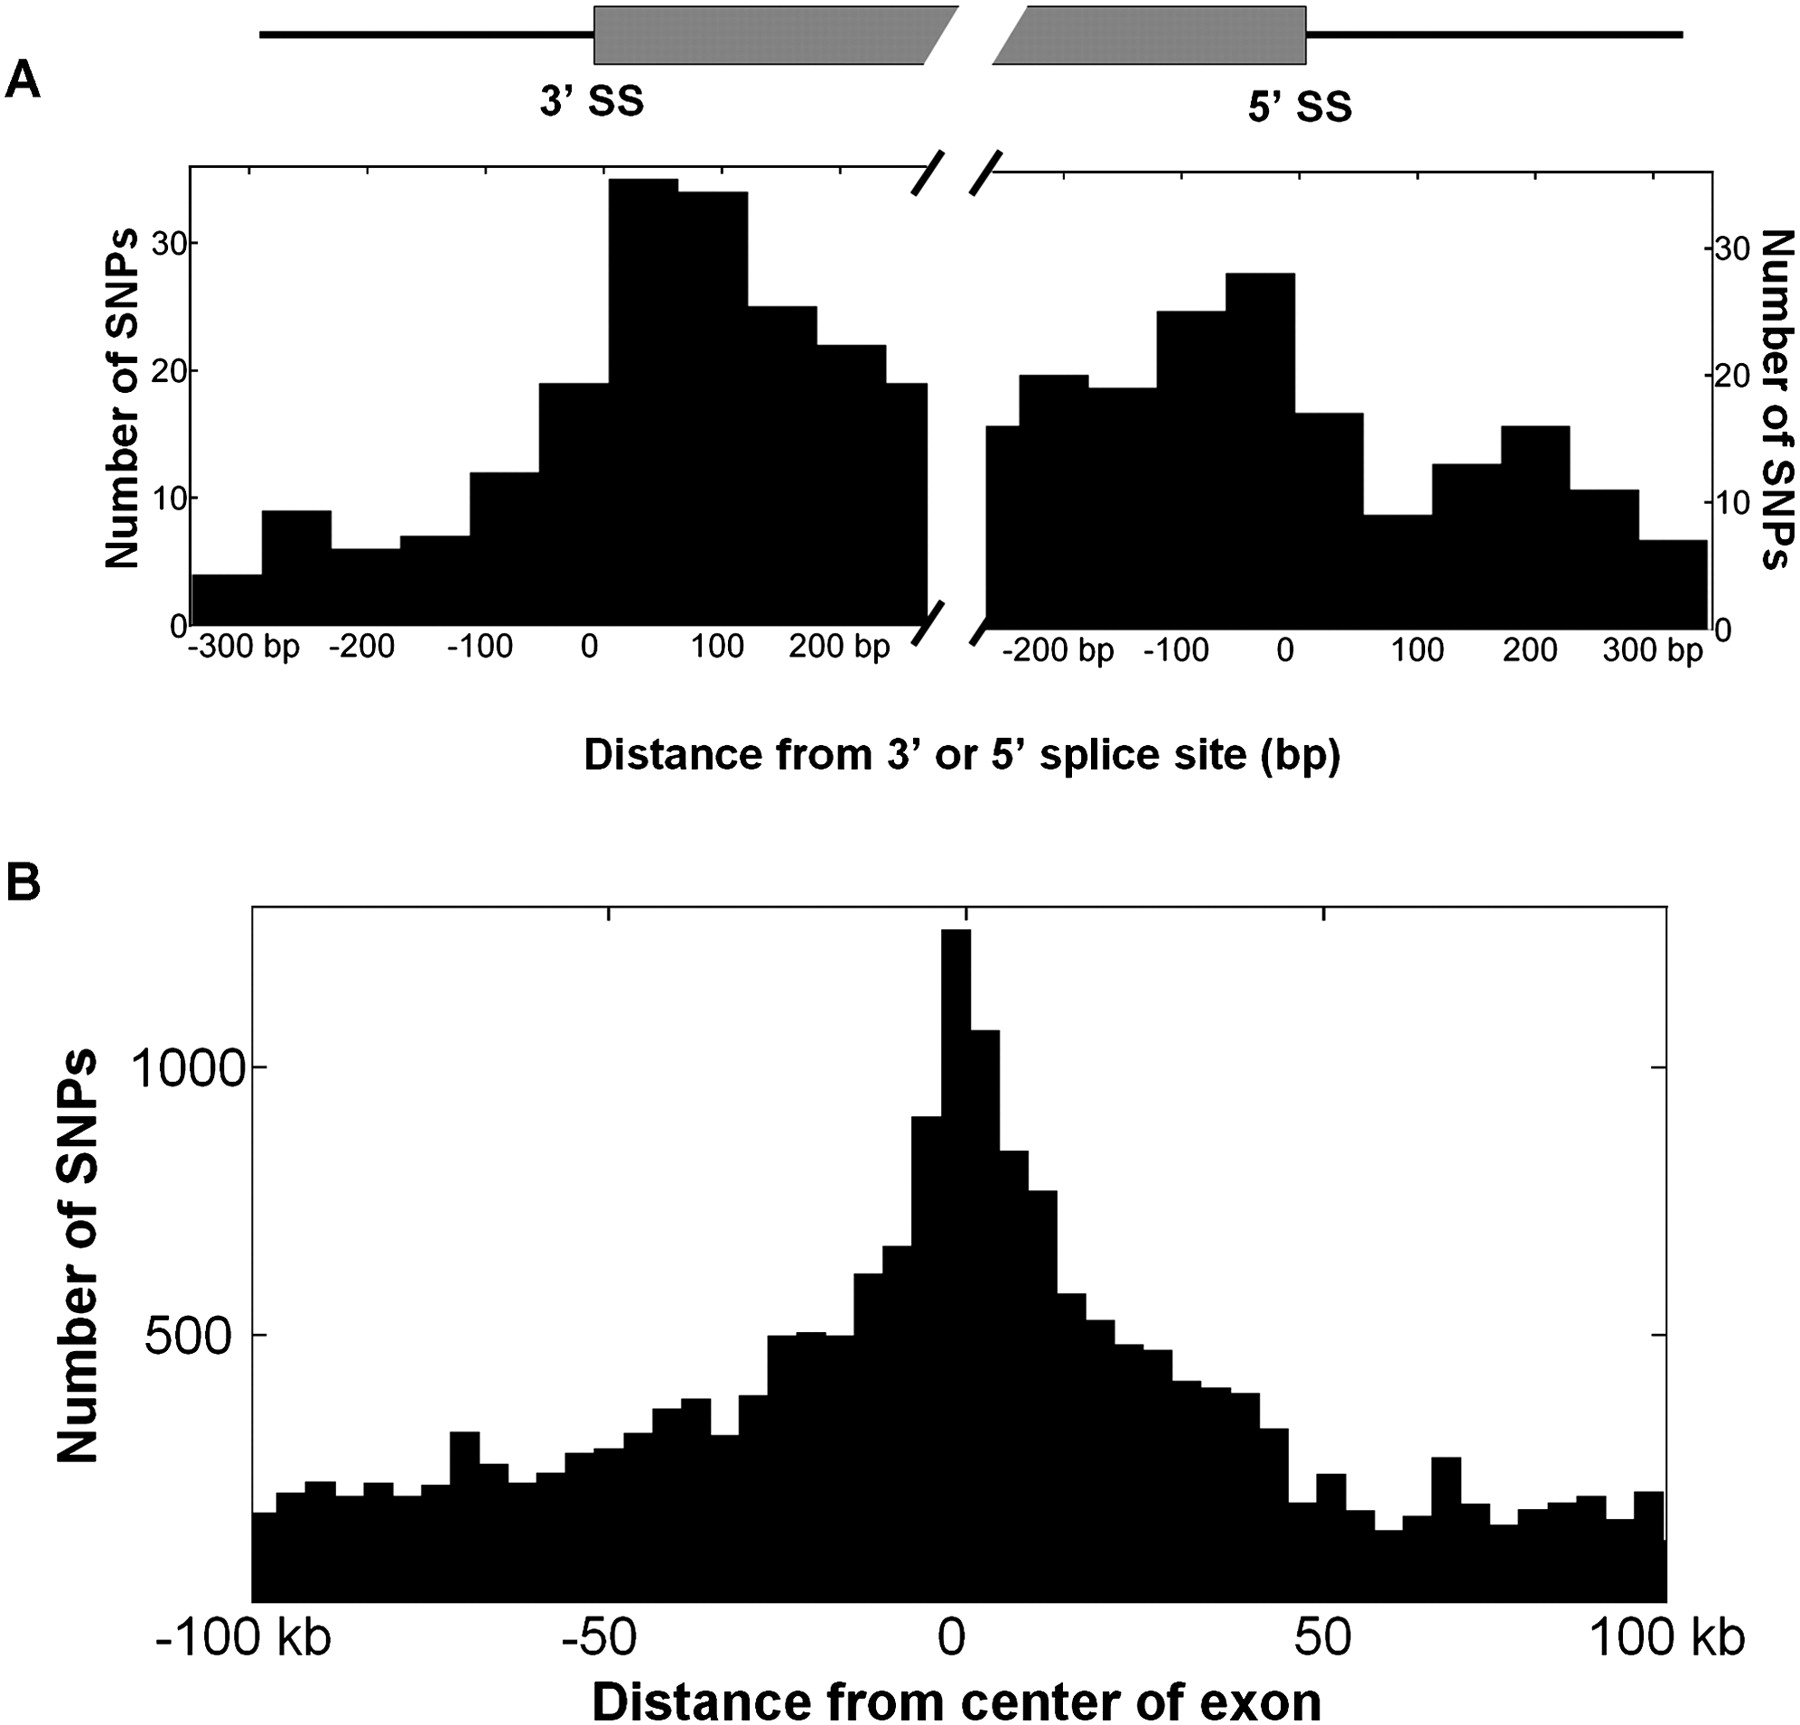
Figure 3.
Spatial distributions of transcript variant-associated SNPs. (A) The distribution of medium-confidence SNPs within several hundred base pairs of splice sites. The greatest densities are inside the exons (gray box), within 100 bp of the exon boundaries. (B) The distribution of (black bars) all medium-confidence SNPs, shown as the distance from the center of the affected exon. There is a peak near zero, and more than half of all SNPs occur within 30 kb on either side.