Figure 3.
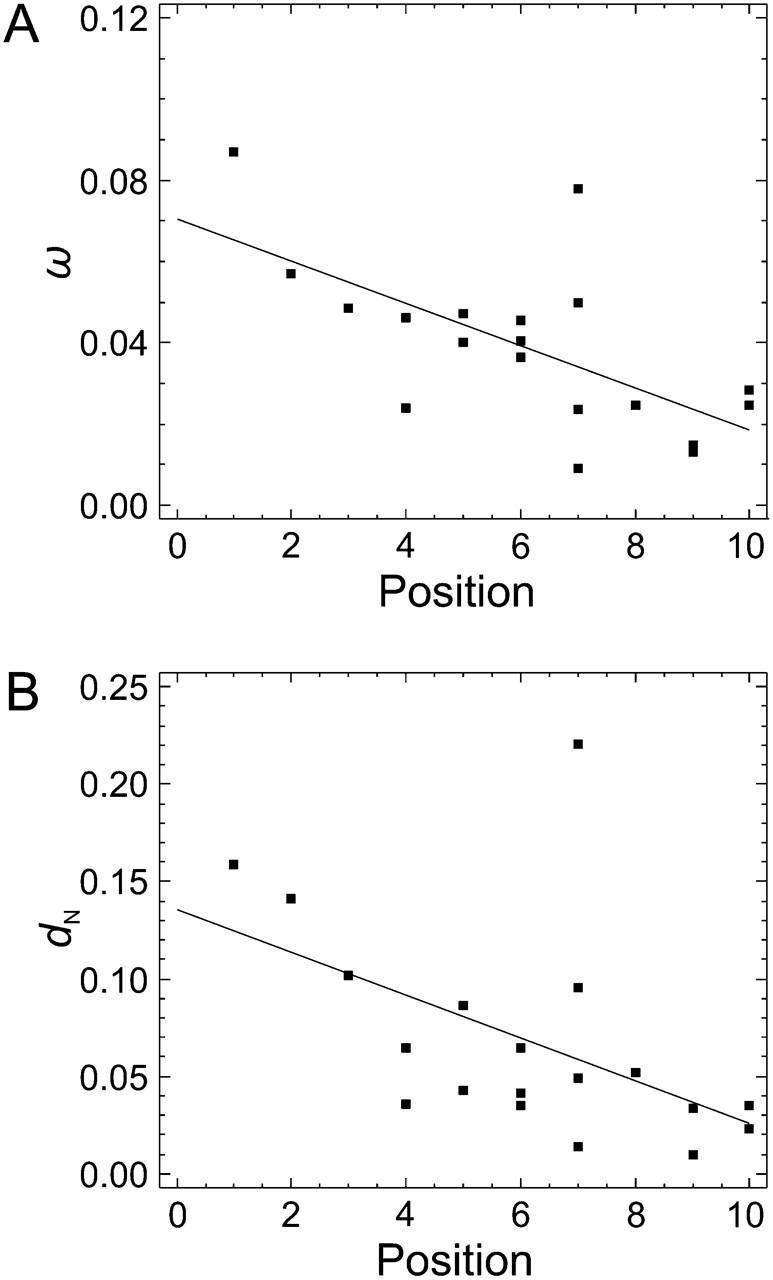
Correlation between the position of the elements in the IT pathway and the ω (A) and dN (B) estimates. Continuous lines represent regression lines.
Correlation between the position of the elements in the IT pathway and the ω (A) and dN (B) estimates. Continuous lines represent regression lines.