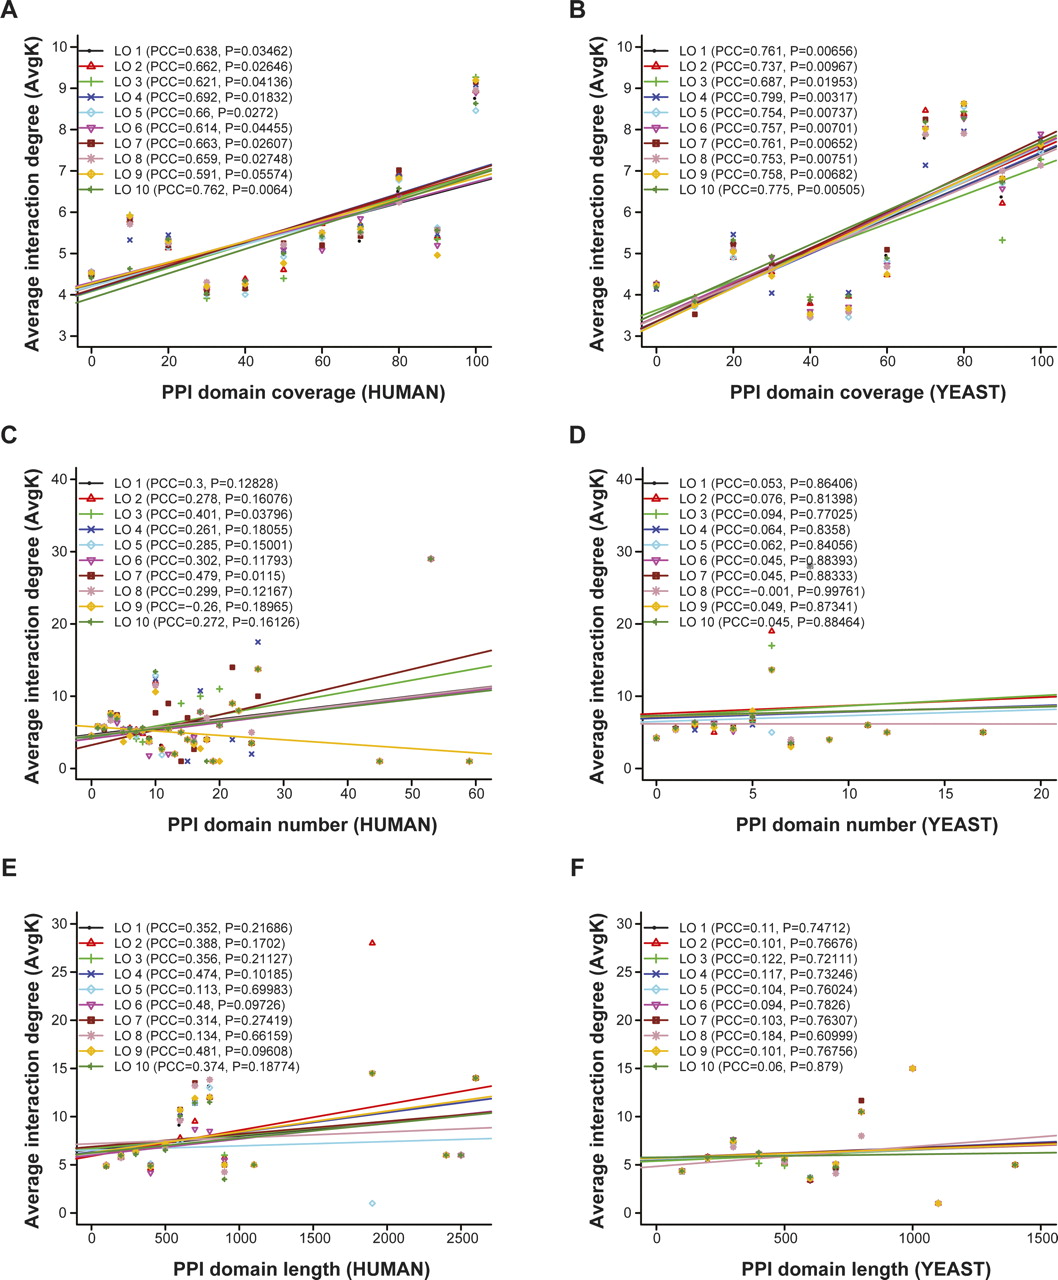
Figure 3.
Relationships of PPI domain coverage, number, and length to PPI degrees by leave-one out analysis. The average human and yeast PPI degrees of proteins in each of the nine out of 10 group combinations within each interval of PPI domain coverage (A,B), PPI domain number (C,D), or PPI domain length (E,F) are plotted against their average values within the intervals. The 10 regression lines, PCCs, and linear regression slope P-values result from 10 leave-one-out analyses (LO1 ∼ 10), one for each nine out of the 10 random protein groups.