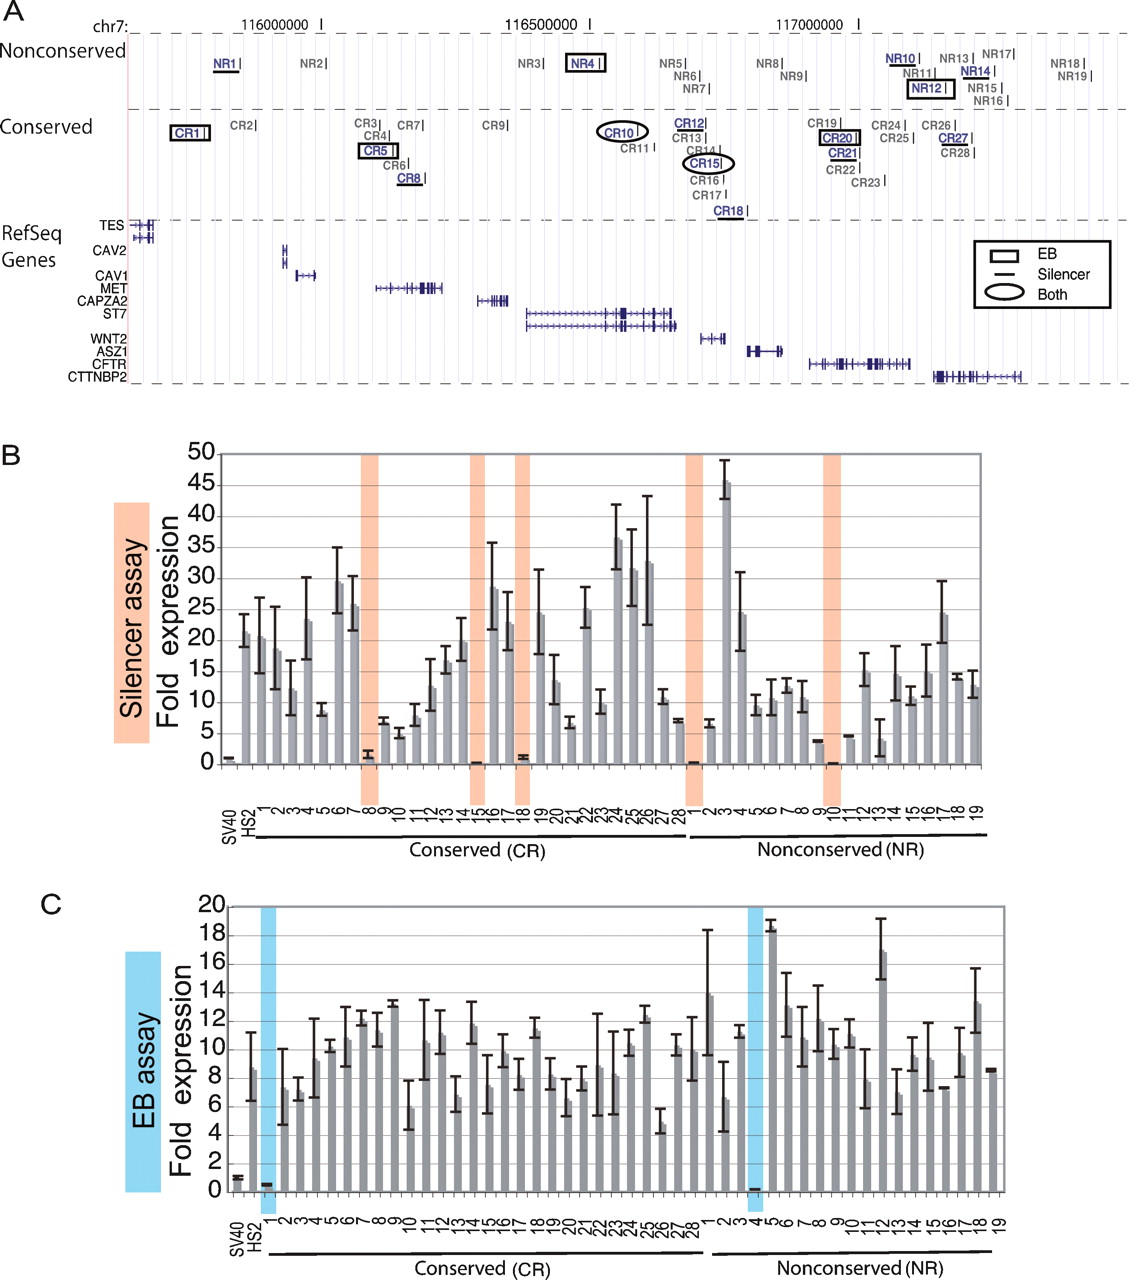
Silencer and EB functions assayed from chromosome 7 sequences. (A) An illustration depicting 47 subcloned elements appears above RefSeq gene annotations from the UCSC Human Genome Browser. The elements are divided into groups as conserved or nonconserved regions (CR or NR, respectively). The numbering scheme increases from left to right across the genomic region. (B) Transfection results for the silencer assay in K562 cells. Controls are the promoter-only (SV40) or the enhancer plasmid (HS2). All of the candidate regions are cloned into the enhancer plasmid, in the forward orientation, upstream of HS2. (C) Transfection results for the EB assay in K562 cells. All candidate regions are cloned into the enhancer plasmid, in the forward orientation, between HS2 and SV40. Silencers and EBs with strong negative effects are shaded light orange and blue, respectively. The results shown are the means from three replicates ± the standard deviation in the error bars. All silencers and EBs were retested in triplicate and resequenced to confirm the results.