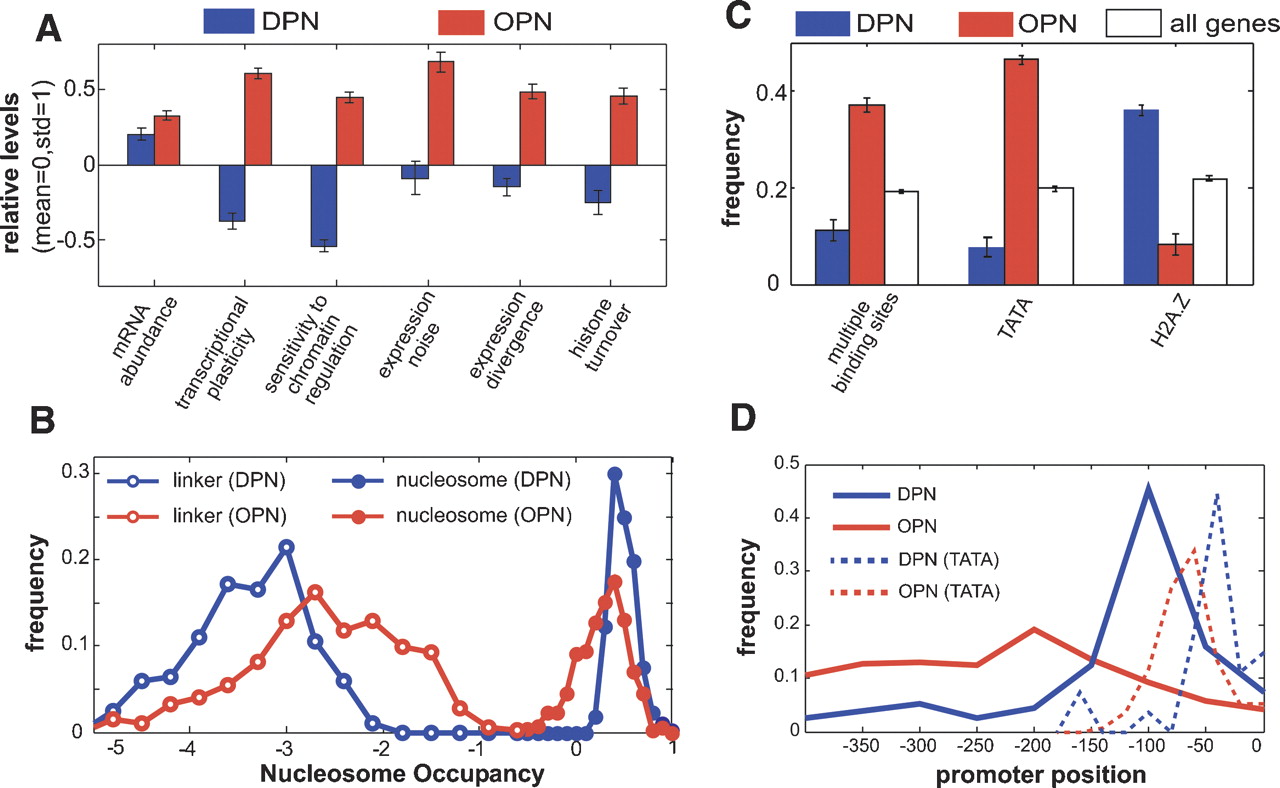
Differential properties of the two promoter classes. (A) Average values of properties that quantify the levels and variability of gene expression and the turnover of promoter H3 histones are shown for DPN genes (blue) and OPN genes (red). Values in each property were normalized to mean zero and standard deviation one. (B) Distribution of the maximal nucleosome occupancy within predicted nucleosomes (filled circles) and the distribution of the minimal nucleosome occupancy within predicted linker DNA (empty circles), for DPN (blue) and OPN (red) genes; distribution of the average occupancy within each element (rather than maximum or minimum) gives similar results (Supplemental Fig. 4). (C) Frequency of genes with multiple binding sites, TATA box, and histone variant H2A.Z is shown for DPN (blue), OPN (red), and all (white) genes. (D) Distribution of the promoter positions of transcription factor binding sites and TATA boxes (dashed lines) in the two classes. Error bars in A and C were calculated by bootstrapping.