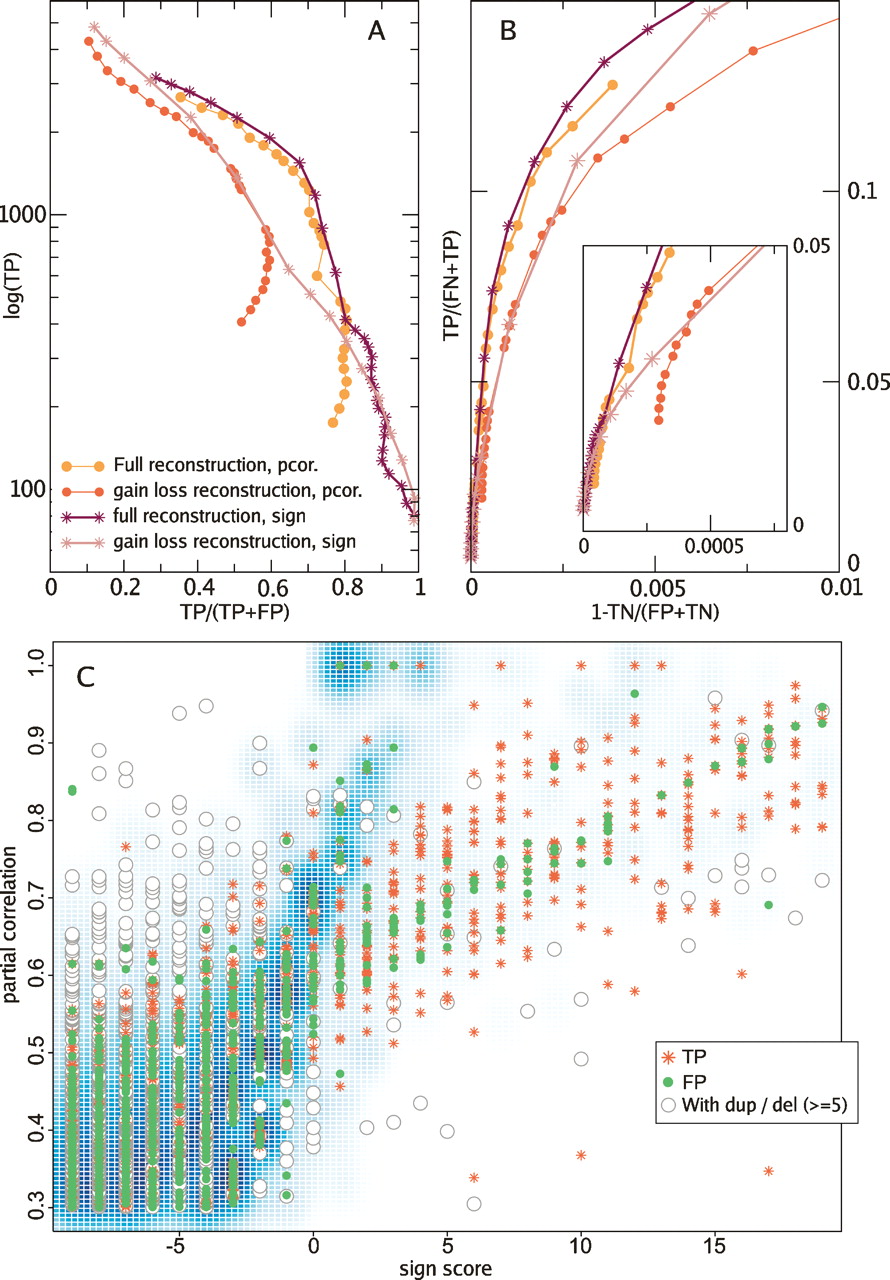
Function prediction with full and gain–loss reconstructions. (A) Accuracy vs. coverage plot shows the number of TP that can be obtained in relationship to the accuracy of the predictions, TP/(TP + FP). (B) ROC (receiver operating characteristics) curve shows the trade off between the false-negative and false-positive rates. The Y-axis can be interpreted as sensitivity, or the ratio of TP to all links that should have been predicted. The X-axis is 1 − specificity, where specificity measures the ratio of true negatives (TN) with respect to all links that are not present in KEGG. Both plots show that the full reconstruction method with partial correlations is a better predictor. (C) Relationship between scores as a smoothed 2D histogram of COG pairs. We see that the scores differ the most when one of the COGs in the predicted link contains a large expansion or contraction.