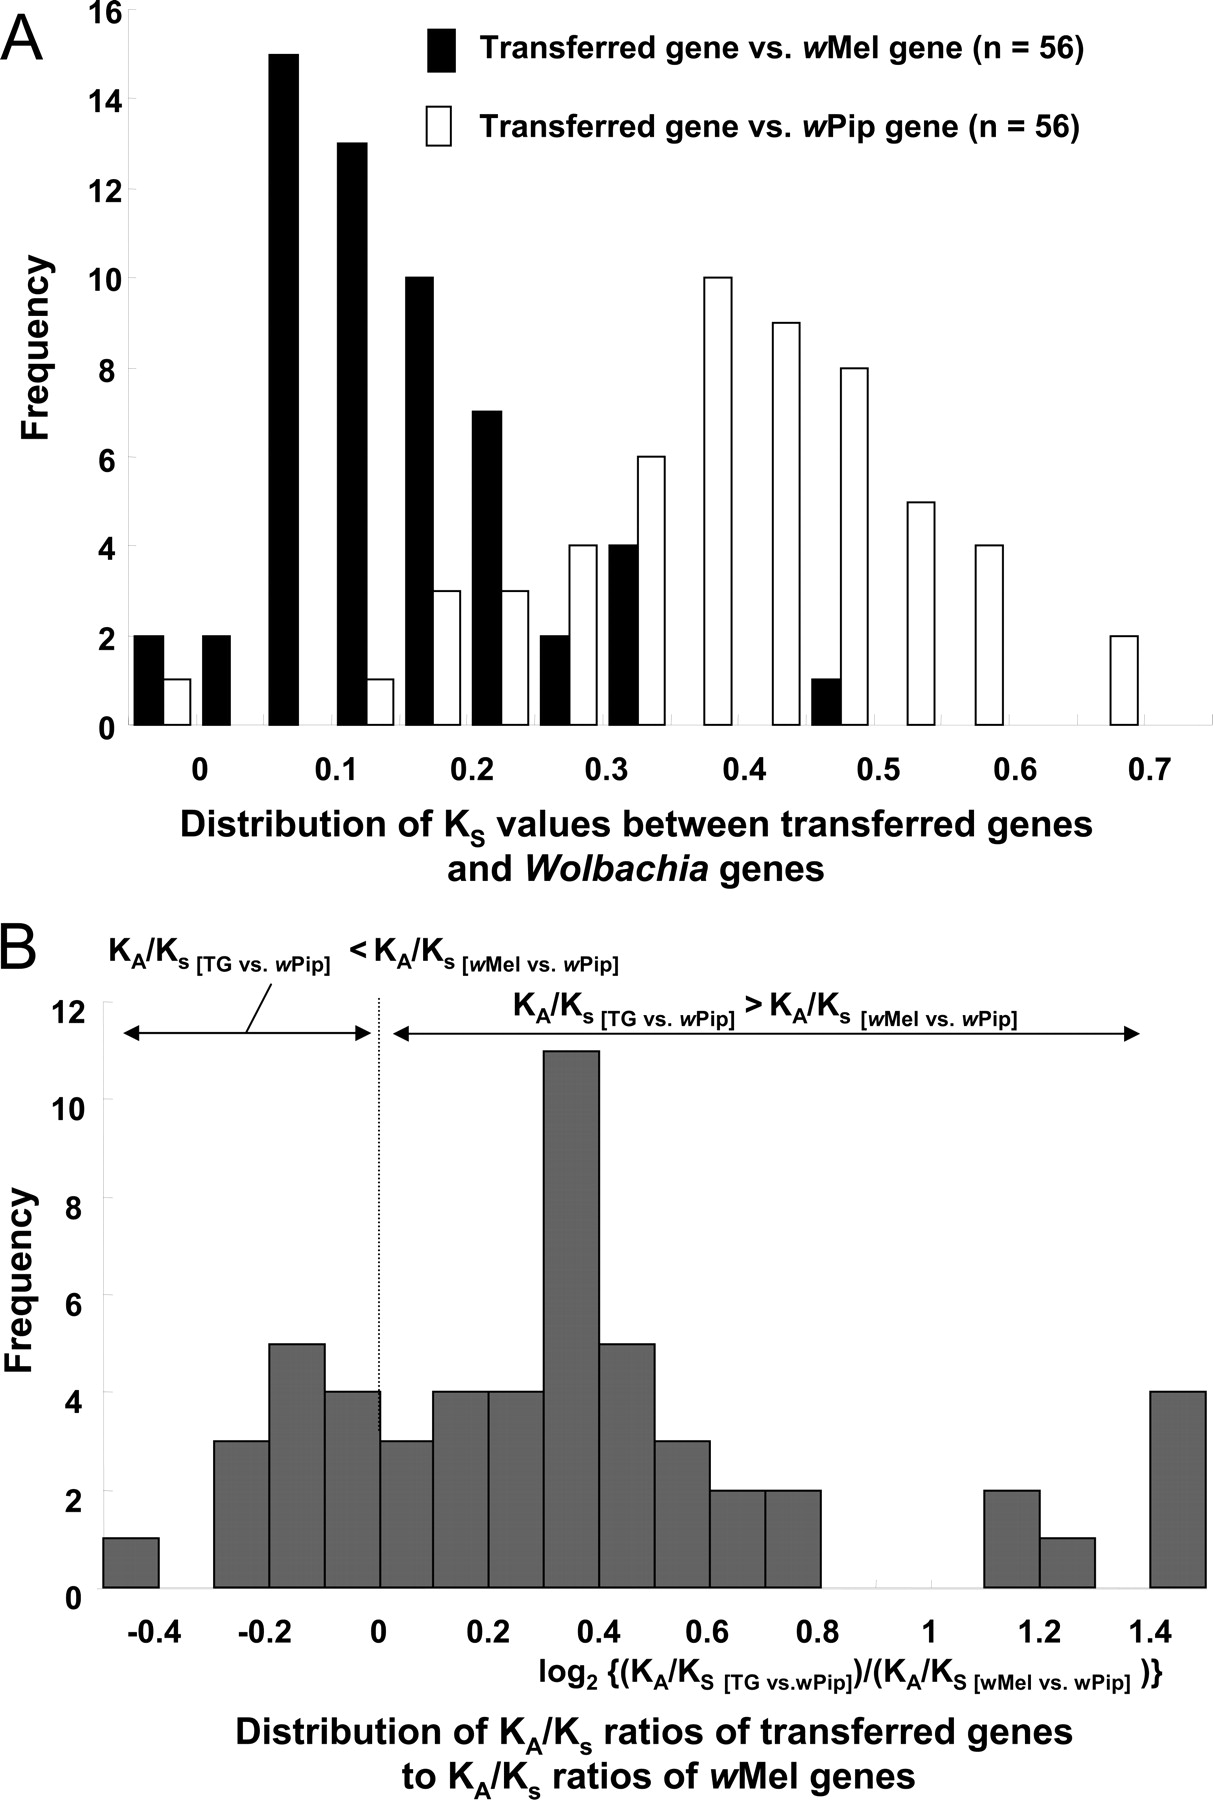
(A) Distribution of genetic distances from the transferred Wolbachia genes: wMel vs. wPip. In total, 56 partial gene sequences were subjected to the analysis (see Supplemental Table S1). Filled bars show the distribution of KS values between transferred Wolbachia genes and wMel genes. Open bars indicate the distribution of KS values between transferred Wolbachia genes and wPip genes. (B) Comparison of molecular evolutionary rate between the transferred Wolbachia genes and the wMel genes. In total, 54 partial gene sequences were subjected to the analysis (see Supplemental Table S1). KA/KS values of transferred genes vs. wPip genes were respectively divided by KA/KS values of wMel genes vs. wPip genes, and the distribution of the log ratios was plotted. In the plot, values less than zero indicate that the transferred genes exhibit lower KA/KS values than the corresponding wMel genes, while values larger than zero imply that the transferred genes show higher KA/KS values than the corresponding wMel genes. Note that the transferred genes generally exhibit higher KA/KS values than the corresponding wMel genes.