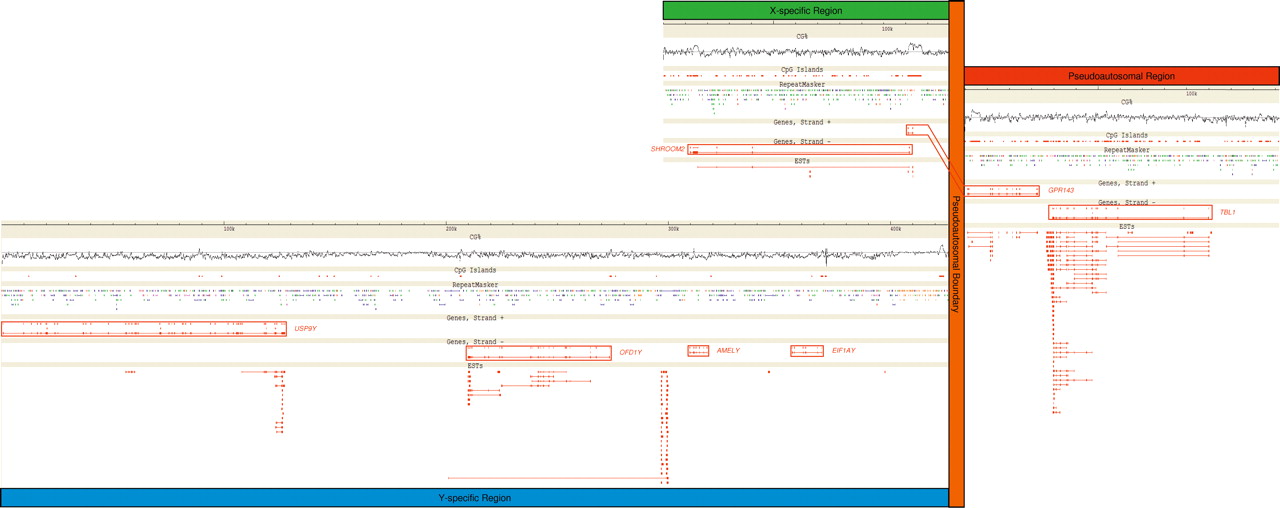
Genomic landscape surrounding the bovine pseudoautosomal boundary: pseudoautosomal region (red), X-specific sequences (green), Y-specific sequences (blue), and pseudoautsomal boundary (orange). (CG%) [G+C] content calculated in a 200-bp sliding window; the horizontal line corresponds to 50% [G+C]. (CpG Islands) CpG islands defined according to Gardiner-Garden and Frommer (1987). (RepeatMasker) Repetitive elements identified with RepeatMasker (A.F.A Smit and P. Green, http://repeatmasker.genome.washington.edu): LTRs (orange), SINEs (blue), LINEs (green), simple repeats (red), tRNAs and snRNAs (black). (Genes) Protein-encoding genes are transcribed from right to left (strand +) or left to right (strand −); gene names are given adjacent to the corresponding boxed gene. (ESTs) ESTs BLASTing to the region with an identity >95% and an E-value <10−50. Most ESTs correspond to identified exons with the notable exception of a cluster of ESTs located between OFD1Y and AMELY. Although very similar, these ESTs show some differences with the genomic sequence and with each other. They probably originate from paralogous loci.