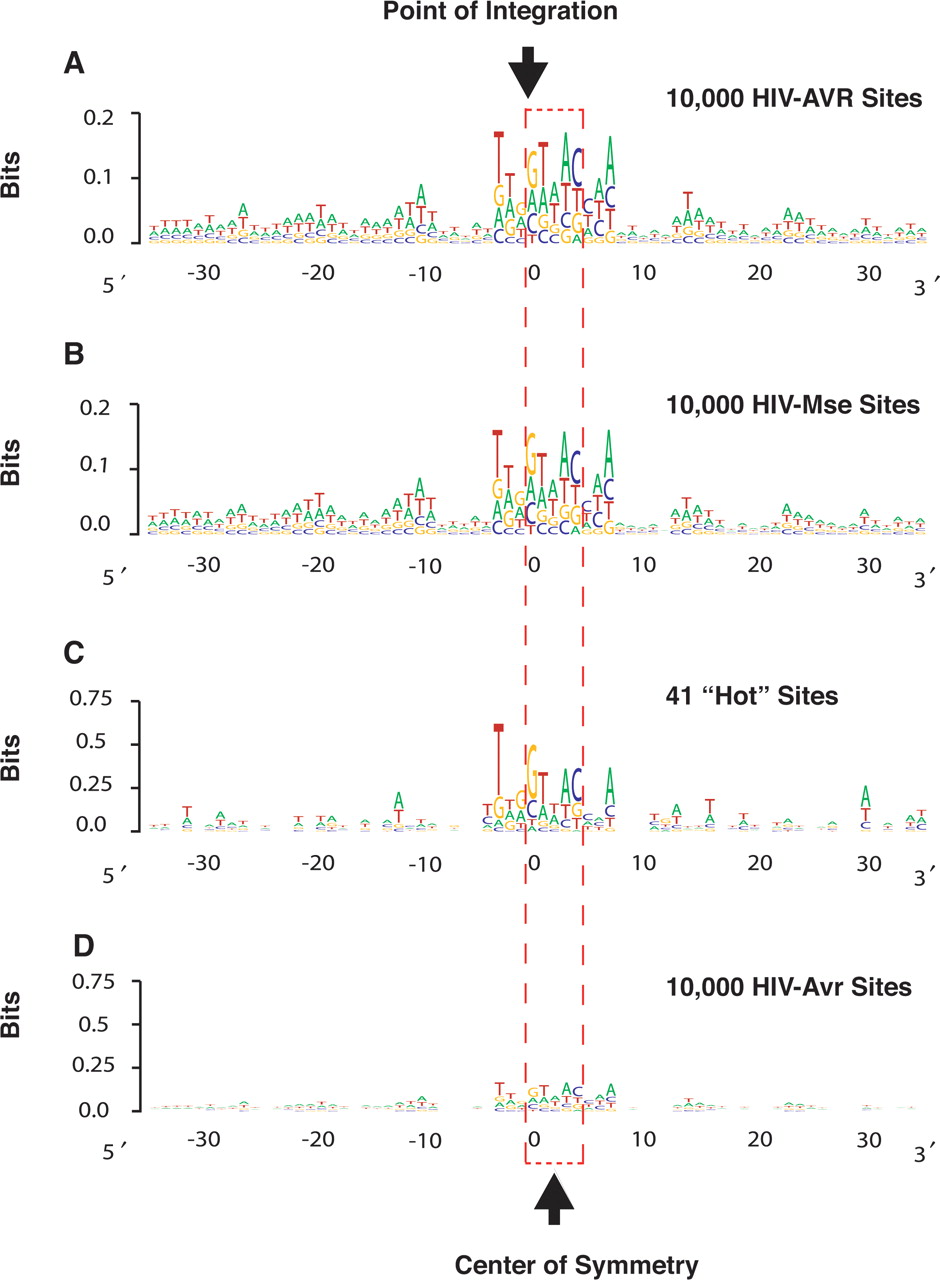
Favored DNA sequences for HIV integration, analyzed using WebLogo. The point of HIV integration in the target DNA sequence occurs between positions 0 and −1 (for the sequenced HIV DNA ends). For the complementary strand, the point of integration occurs between positions 4 and 5. Y-axis represents the information content at each target base position (perfect conservation would have a score of 2 bits). The height of the letter reflects the degree of base conservation. (A) Analysis 10,000 HIV-Avr sites. (B) Analysis of 10,000 HIV-Mse sites. (C) Forty-one integration sites that host two independent integration events, compared with 10,000 HIV-Avr sites (D). Essentially identical results were obtained for comparison to HIV-Mse sites (data not shown). Note the difference in scale of the Y-axis.